
ETF Tracker StatSheet
————————————————————-
————————————————————
Market Commentary
- Moving the Markets
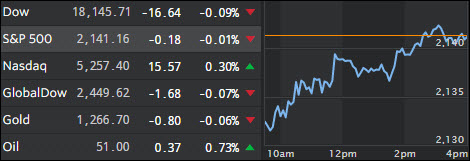
The major indexes ended up just about unchanged with the exception of the Nasdaq which eked out at +0.30% gain. Energy and Healthcare fell while Microsoft and McDonald’s kept the markets propped up. Still, questions keep coming up as to whether the lack of pace with regards to economic activity can justify the current lofty equity levels.
As I have repeatedly posted, macro data have been on a downward slide for a couple of months now, and it’s just a matter of time when the major indexes have to adjust to that reality. Of course, with Central Banks manipulating markets higher, there is no way of knowing when that moment of truth will arrive. Here’s the visual, thanks to ZH, in regards to the divergence between the S&P 500 and current US Macro data:
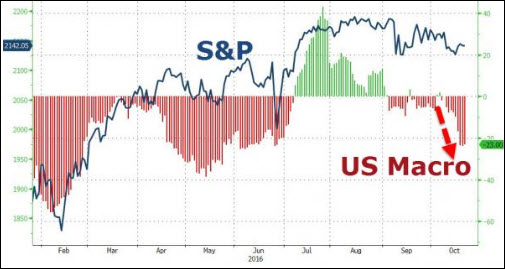
You can clearly see what happened historically when economic data points fall off a cliff. We may have a little more falling to do before the stock indexes react negatively, although it’s also clear that around April this year, the Fed stepped in to support the markets.
- ETFs in the Spotlight
In case you missed the announcement and description of this section, you can read it here again.
It features 10 broadly diversified ETFs from my HighVolume list as posted every Monday. Furthermore, they are screened for the lowest MaxDD% number meaning they have been showing better resistance to temporary sell offs than all others over the past year.
Here are the 10 candidates:
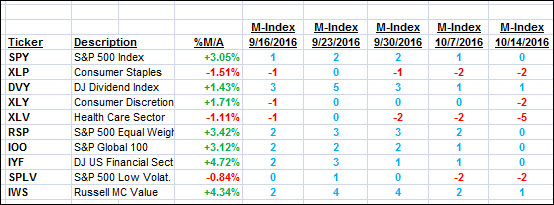
The above table simply demonstrates the magnitude with which some of the ETFs are fluctuating in regards to their positions above or below their respective individual trend lines (%M/A). A break below, represented by a negative number, shows weakness, while a break above, represented by a positive percentage, shows strength.
For hundreds of ETF choices, be sure to reference Thursday’s StatSheet.
Year to date, here’s how the above candidates have fared so far:
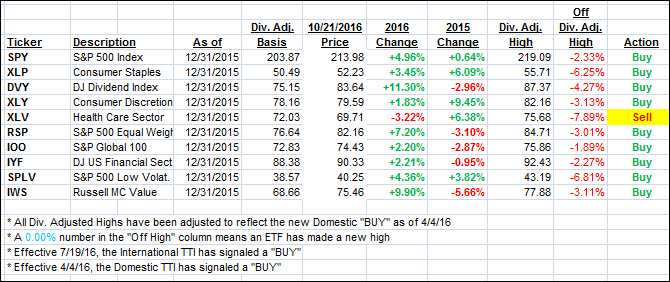
Again, the first table above shows the position of the various ETFs in relation to their respective long term trend lines (%M/A), while the second one tracks their trailing sell stops in the “Off High” column. The “Action” column will signal a “Sell” once the -7.5% point has been taken out in the “Off High” column.
- Trend Tracking Indexes (TTIs)
Both of our Trend Tracking Indexes (TTIs) headed north while the S&P 500 eked out a gain of 0.38% for the week.
Here’s how we closed 10/21/2016:
Domestic TTI: +1.45% (last Friday +1.32%)—Buy signal effective 4/4/2016
International TTI: +3.24% (last Friday +2.76%)—Buy signal effective 7/19/2016
Have a great weekend.
Ulli…
Disclosure: I am obliged to inform you that I, as well as my advisory clients, own some of the ETFs listed in the above table. Furthermore, they do not represent a specific investment recommendation for you, they merely show which ETFs from the universe I track are falling within the guidelines specified.
————————————————————-
READER Q & A FOR THE WEEK
All Reader Q & A’s are listed at our web site!
Check it out at:
https://theetfbully.com/questions-answers/
———————————————————-
WOULD YOU LIKE TO HAVE YOUR INVESTMENTS PROFESSIONALLY MANAGED?
Do you have the time to follow our investment plans yourself? If you are a busy professional who would like to have his portfolio managed using our methodology, please contact me directly or get more details at:
https://theetfbully.com/personal-investment-management/
———————————————————
Back issues of the ETF/No Load Fund Tracker are available on the web at:
https://theetfbully.com/newsletter-archives/
Contact Ulli