
- Moving the Markets
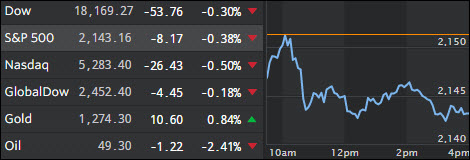
After a weak opening, the S&P 500 managed to kiss the unchanged line, but it was all downhill from there as stocks slipped from their 2-week highs made yesterday. Not helping matters was the dying Consumer Confidence bounce with the indicator sporting its biggest plunge in 11 months.
The US dollar continued its spike upwards supported in part by ever increasing interest rate hike odds, which now have topped 70%. While that may spell trouble for equities in the months ahead, a neutralizing factor could be a continued voracious appetite for stocks, a least for the time being.
Globally, economic weakness prevails as bellwether Caterpillar seems to confirm month after month. They have now failed for 46 consecutive months to post a retail sales increase. They again missed not only revenues but also slashed full year guidance. But then again, none of these realities matter to the markets as long as we can count on or hope for further Central Bank accommodative policies.
- ETFs in the Spotlight
In case you missed the announcement and description of this section, you can read it here again.
It features 10 broadly diversified ETFs from my HighVolume list as posted every Monday. Furthermore, they are screened for the lowest MaxDD% number meaning they have been showing better resistance to temporary sell offs than all others over the past year.
Here are the 10 candidates:
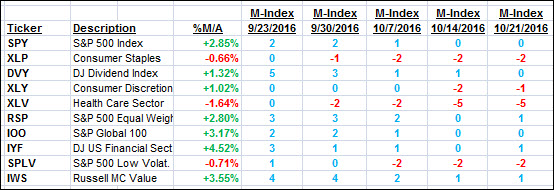
The above table simply demonstrates the magnitude with which some of the ETFs are fluctuating in regards to their positions above or below their respective individual trend lines (%M/A). A break below, represented by a negative number, shows weakness, while a break above, represented by a positive percentage, shows strength.
For hundreds of ETF choices, be sure to reference Thursday’s StatSheet.
Year to date, here’s how the above candidates have fared so far:
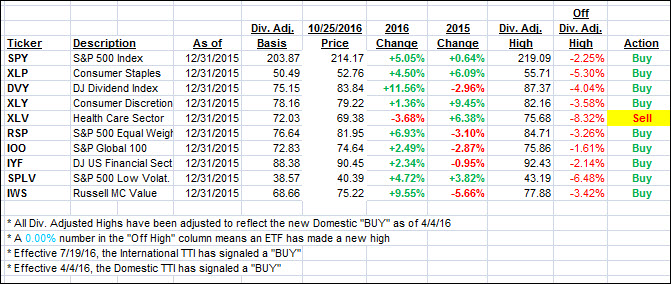
Again, the first table above shows the position of the various ETFs in relation to their respective long term trend lines (%M/A), while the second one tracks their trailing sell stops in the “Off High” column. The “Action” column will signal a “Sell” once the -7.5% point has been taken out in the “Off High” column.
- Trend Tracking Indexes (TTIs)
Both of our Trend Tracking Indexes (TTIs) went south as earnings and economic data points failed to impress.
Here’s how we closed 10/25/2016:
Domestic TTI: +1.36% (last close +1.69%)—Buy signal effective 4/4/2016
International TTI: +3.20% (last close +3.43%)—Buy signal effective 7/19/2016
Disclosure: I am obliged to inform you that I, as well as my advisory clients, own some of the ETFs listed in the above table. Furthermore, they do not represent a specific investment recommendation for you, they merely show which ETFs from the universe I track are falling within the guidelines specified.
Contact Ulli