
1. Moving the Markets
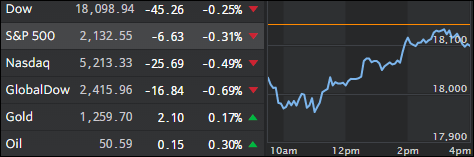
Equities continued their downward trend following weak Chinese data but a turnaround in oil prices pulled the major indexes back up and limited the decline to -0.31% for the S&P 500.
The negative catalyst was Chinese exports falling 10% in September, which was far worse than expected while imports also shrank unexpectedly.
Adding to that is the continued uncertainty about the upcoming elections and the ever increasing mudslinging, which has turned this event into the most watched soap opera. This is the time to maintain a limited involvement along with a conservative exposure in the markets as sudden events could rock the boat severely.
2. ETFs in the Spotlight
In case you missed the announcement and description of this section, you can read it here again.
It features 10 broadly diversified ETFs from my HighVolume list as posted every Monday. Furthermore, they are screened for the lowest MaxDD% number meaning they have been showing better resistance to temporary sell offs than all others over the past year.
Here are the 10 candidates:
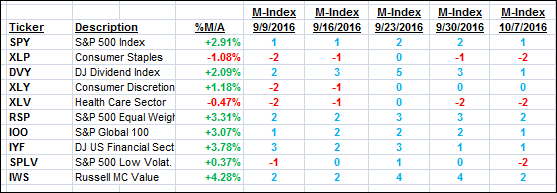
The above table simply demonstrates the magnitude with which some of the ETFs are fluctuating in regards to their positions above or below their respective individual trend lines (%M/A). A break below, represented by a negative number, shows weakness, while a break above, represented by a positive percentage, shows strength.
For hundreds of ETF choices, be sure to reference Thursday’s StatSheet.
Year to date, here’s how the above candidates have fared so far:
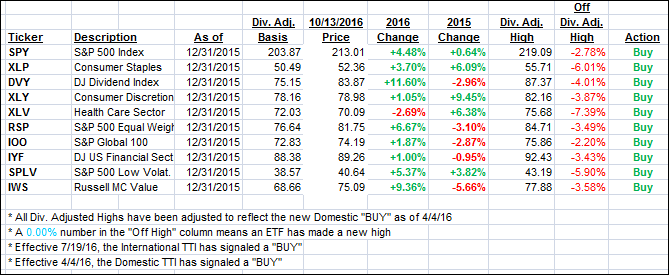
Again, the first table above shows the position of the various ETFs in relation to their respective long term trend lines (%M/A), while the second one tracks their trailing sell stops in the “Off High” column. The “Action” column will signal a “Sell” once the -7.5% point has been taken out in the “Off High” column.
3. Trend Tracking Indexes (TTIs)
Our Trend Tracking Indexes (TTIs) slipped as the major indexes closed lower again.
Here’s how we closed 10/13/2016:
Domestic TTI: +1.47% (last close +1.62%)—Buy signal effective 4/4/2016
International TTI: +2.90% (last close +3.22%)—Buy signal effective 7/19/2016
Disclosure: I am obliged to inform you that I, as well as my advisory clients, own some of the ETFs listed in the above table. Furthermore, they do not represent a specific investment recommendation for you, they merely show which ETFs from the universe I track are falling within the guidelines specified.
Contact Ulli