
1. Moving the Markets
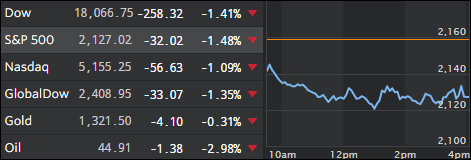
Today’s pullback certainly made yesterday’s rebound look like a dead cat bounce. Of course, you can never be sure but stocks shifted into reverse today falling sharply led by lower oil prices and weak financials.
Despite Fed officials taking a more dovish stance, there appears to be a heightened level of insecurity regarding potential rate hikes; or, markets have gotten simply tired of the endless jawboning and have lost confidence in the Fed’s commentary du jour.
Again, volatility has returned, and the major indexes have moved more than 1% in either direction in the past 3 days, which is something that we’ve not seen all summer. There is probably more to come, and it is important that you know when to execute your sell stops just in case this pullback turns into a full blown bear market.
If you tend to ignore bear markets, please take a look at the chart below:
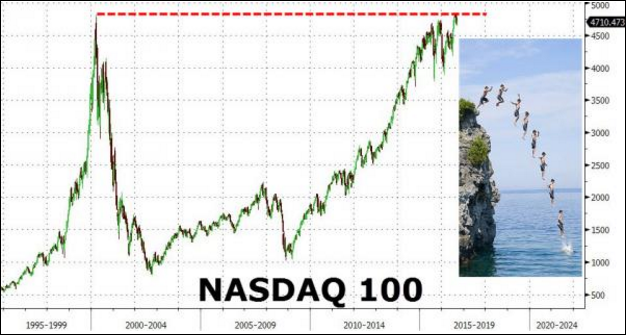
Chart courtesy of ZeroHedge
2. ETFs in the Spotlight
In case you missed the announcement and description of this section, you can read it here again.
It features 10 broadly diversified ETFs from my HighVolume list as posted every Monday. Furthermore, they are screened for the lowest MaxDD% number meaning they have been showing better resistance to temporary sell offs than all others over the past year.
Here are the 10 candidates:
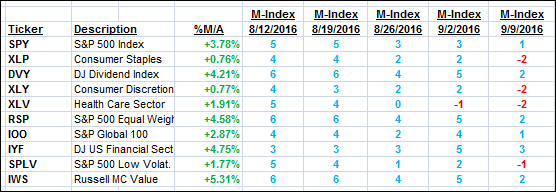
The above table simply demonstrates the magnitude with which some of the ETFs are fluctuating in regards to their positions above or below their respective individual trend lines (%M/A). A break below, represented by a negative number, shows weakness, while a break above, represented by a positive percentage, shows strength.
For hundreds of ETF choices, be sure to reference Thursday’s StatSheet.
Year to date, here’s how the above candidates have fared so far:
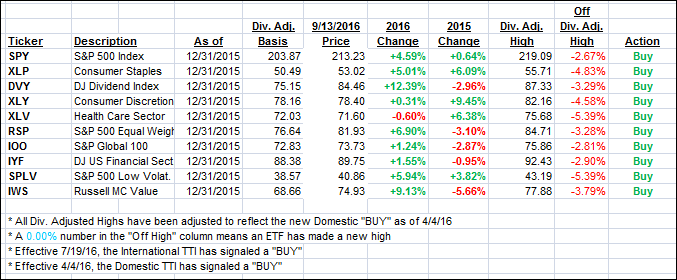
Again, the first table above shows the position of the various ETFs in relation to their respective long term trend lines (%M/A), while the second one tracks their trailing sell stops in the “Off High” column. The “Action” column will signal a “Sell” once the -7.5% point has been taken out in the “Off High” column.
3. Trend Tracking Indexes (TTIs)
Our Trend Tracking Indexes (TTIs) went the other way and closed lower. While we’re still in bullish territory, one of our positions is close to triggerering its trailing sell stop and will be liquidated should more downside momentum occur.
Here’s how we closed 9/13/2016:
Domestic TTI: +1.78% (last close +2.35%)—Buy signal effective 4/4/2016
International TTI: +3.31% (last close +4.75%)—Buy signal effective 7/19/2016
Disclosure: I am obliged to inform you that I, as well as my advisory clients, own some of the ETFs listed in the above table. Furthermore, they do not represent a specific investment recommendation for you, they merely show which ETFs from the universe I track are falling within the guidelines specified.
Contact Ulli