
1. Moving the Markets
On Friday, I mentioned that the Fed might attempt to talk this market back up after the sharp and sudden pullback. As if on cue, three Fed govs, namely Brainard, Lockhart and Kashkari, used various venues to opine the predominantly dovish message that a rate hike might not be compelling.
That’s all it took, and the algos ran amok pulling the major indexes out of the doldrums and, more importantly, pulled interest rates back down after Friday’s spooky spike. Of course, no one can be sure that all is well again, and that we’ll continue to go higher from here. Personally, I expect more fireworks as we head deeper into the notoriously volatile season of the year.
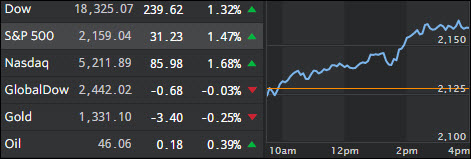
In oil news today, we saw U.S. Crude imports rise .31% to $46.02 a barrel. U.S. average never really rose above $50 a barrel over the summer months, which usually experience high seasonality increases due to travel. That is leading analysts to believe that prices will remain within the $40-$50 a barrel bracket through the fall season.
2. ETFs in the Spotlight
In case you missed the announcement and description of this section, you can read it here again.
It features 10 broadly diversified ETFs from my HighVolume list as posted every Monday. Furthermore, they are screened for the lowest MaxDD% number meaning they have been showing better resistance to temporary sell offs than all others over the past year.
Here are the 10 candidates:
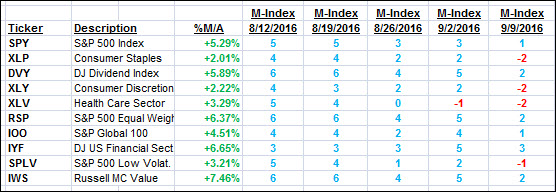
The above table simply demonstrates the magnitude with which some of the ETFs are fluctuating in regards to their positions above or below their respective individual trend lines (%M/A). A break below, represented by a negative number, shows weakness, while a break above, represented by a positive percentage, shows strength.
For hundreds of ETF choices, be sure to reference Thursday’s StatSheet.
Year to date, here’s how the above candidates have fared so far:
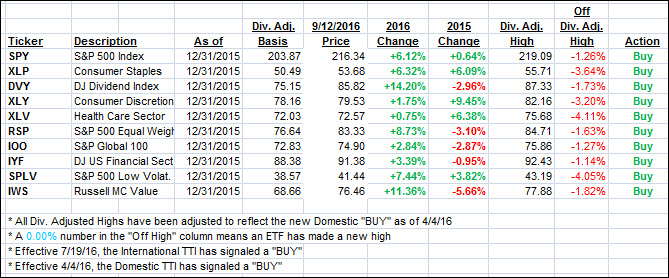
Again, the first table above shows the position of the various ETFs in relation to their respective long term trend lines (%M/A), while the second one tracks their trailing sell stops in the “Off High” column. The “Action” column will signal a “Sell” once the -7.5% point has been taken out in the “Off High” column.
3. Trend Tracking Indexes (TTIs)
Our Trend Tracking Indexes (TTIs) headed higher again as dovish Fed jawboning prevented the indexes from continuing south—at least for the time being.
Here’s how we closed 9/12/2016:
Domestic TTI: +2.35% (last close +1.75%)—Buy signal effective 4/4/2016
International TTI: +4.75% (last close +4.02%)—Buy signal effective 7/19/2016
Disclosure: I am obliged to inform you that I, as well as my advisory clients, own some of the ETFs listed in the above table. Furthermore, they do not represent a specific investment recommendation for you, they merely show which ETFs from the universe I track are falling within the guidelines specified.
Contact Ulli