
1. Moving the Markets
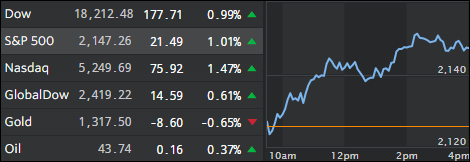
U.S. stocks, which have entered a difficult and more volatile stretch in recent sessions, were rebounding today despite lower-than-expected retail sales last month and continued concerns about whether central bank policy will become less market-friendly.
The Dow is being helped by another rally in shares of iPhone maker Apple (AAPL), which are up 3.4% today to $115.57, extending its gain this week to more than 12% on optimism surrounding the release of the latest version of the iPhone. This capped a 4-day surge which entails a 14% climb. While the iPhone 7 roll-out may not be as dazzling as predecessors, it seems that the brand still holds weight regardless.
With interest rate uncertainty weighing on markets ahead of the Federal Reserve’s highly anticipated policy decision next Wednesday, Wall Street turned its attention to a batch of fresh economic data today, which came in mixed. In a sign that consumers are spending less, August retail sales fell 0.3%, which was more than the drop 0.1% analysts had forecast. That was the first time monthly sales have been negative since March this year. On the inflation front, prices at the wholesale level also came in lower-than-expected, with the producer price index (PPI) coming in 0.1% shy of the September forecast.
2. ETFs in the Spotlight
In case you missed the announcement and description of this section, you can read it here again.
It features 10 broadly diversified ETFs from my HighVolume list as posted every Monday. Furthermore, they are screened for the lowest MaxDD% number meaning they have been showing better resistance to temporary sell offs than all others over the past year.
Here are the 10 candidates:
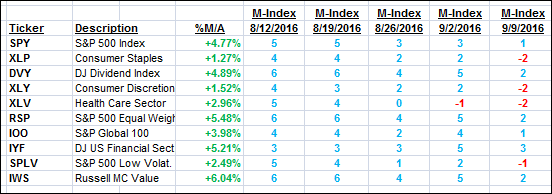
The above table simply demonstrates the magnitude with which some of the ETFs are fluctuating in regards to their positions above or below their respective individual trend lines (%M/A). A break below, represented by a negative number, shows weakness, while a break above, represented by a positive percentage, shows strength.
For hundreds of ETF choices, be sure to reference Thursday’s StatSheet.
Year to date, here’s how the above candidates have fared so far:
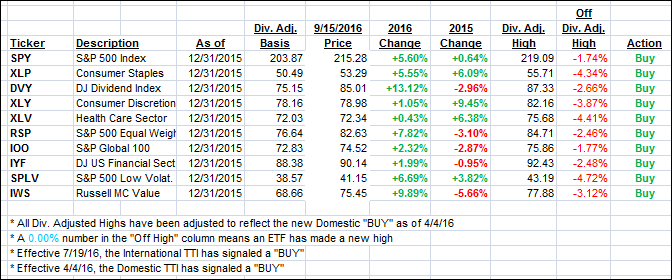
Again, the first table above shows the position of the various ETFs in relation to their respective long term trend lines (%M/A), while the second one tracks their trailing sell stops in the “Off High” column. The “Action” column will signal a “Sell” once the -7.5% point has been taken out in the “Off High” column.
3. Trend Tracking Indexes (TTIs)
Our Trend Tracking Indexes (TTIs) picked up some steam and headed north joining the rebounding major indexes.
Here’s how we closed 9/15/2016:
Domestic TTI: +2.29% (last close +1.83%)—Buy signal effective 4/4/2016
International TTI: +3.92% (last close +3.32%)—Buy signal effective 7/19/2016
Disclosure: I am obliged to inform you that I, as well as my advisory clients, own some of the ETFs listed in the above table. Furthermore, they do not represent a specific investment recommendation for you, they merely show which ETFs from the universe I track are falling within the guidelines specified.
Contact Ulli