
1. Moving the Markets
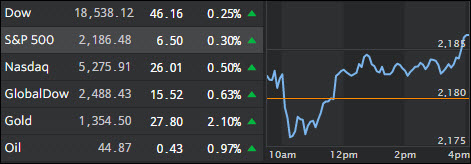
Stocks remained in positive territory today, even after the weakest reading on the services sector of the economy in six years, as traders returned from the long holiday weekend. It seems that Wall Street is still digesting Friday’s August jobs report (which most investors say will keep the Federal Reserve from hiking interest rates later this month), however, it bared no exuberant motions in trading today. Given the horrific economic data points as of late which, in a normal market would have pushed the major indexes south, it’s become clear that the Fed is politically motivated to support the encumbent party by keeping the markets as elevated for as long as possible.
More and more investors are somewhat on edge amid a stock market that continues to hover near all-time highs but is trading at way above-average valuations. All three major U.S. stock indexes kicked off the week within 1% of their all-time highs hit in mid-August and there is no apparent “market moving” indication that the situation will change anytime soon. That is until a black swan event reverals the magnitude of the air pocket below.
In deal news today, we heard that Volkswagen intends to take a $256 million, or 16.6%, stake in Navistar International (NAV) in an effort to get exposure in the U.S. heavy-truck market. Navistar’s shares jumped more than 50%, while VW stock was off by about 8%. The deal includes technology sharing and joint purchasing and related cost savings, the companies said Tuesday. In addition, Bayer AG upped its offer for Monsanto for a second time to $127.50 per share, which would price any deal at close to $56 billion.
2. ETFs in the Spotlight
In case you missed the announcement and description of this section, you can read it here again.
It features 10 broadly diversified ETFs from my HighVolume list as posted every Monday. Furthermore, they are screened for the lowest MaxDD% number meaning they have been showing better resistance to temporary sell offs than all others over the past year.
Here are the 10 candidates:
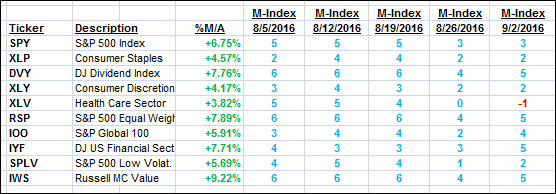
The above table simply demonstrates the magnitude with which some of the ETFs are fluctuating in regards to their positions above or below their respective individual trend lines (%M/A). A break below, represented by a negative number, shows weakness, while a break above, represented by a positive percentage, shows strength.
For hundreds of ETF choices, be sure to reference Thursday’s StatSheet.
Year to date, here’s how the above candidates have fared so far:
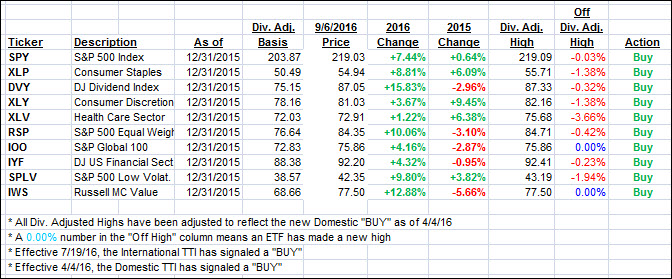
Again, the first table above shows the position of the various ETFs in relation to their respective long term trend lines (%M/A), while the second one tracks their trailing sell stops in the “Off High” column. The “Action” column will signal a “Sell” once the -7.5% point has been taken out in the “Off High” column.
3. Trend Tracking Indexes (TTIs)
Our Trend Tracking Indexes (TTIs) climbed with the indexes as poor economic data again provided the backdrop for higher stock prices.
Here’s how we closed 9/6/2016:
Domestic TTI: +3.09% (last close +2.92%)—Buy signal effective 4/4/2016
International TTI: +5.97% (last close +5.39%)—Buy signal effective 7/19/2016
Disclosure: I am obliged to inform you that I, as well as my advisory clients, own some of the ETFs listed in the above table. Furthermore, they do not represent a specific investment recommendation for you, they merely show which ETFs from the universe I track are falling within the guidelines specified.
Contact Ulli