
1. Moving the Markets
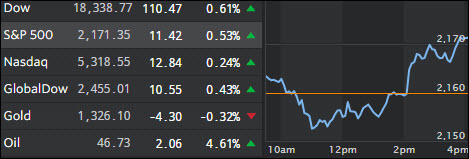
After an early drop, the markets recovered and managed to close in the green in part due to quarterly window dressing. Oil shifted into high gear and gained some 4.6% on renewed Saudi jawboning about future production limits.
The spot on article “This market calm feels like mayhem” by ZH, points to anxieties by investors, which I summarized as follows:
-
This is the most difficult, treacherous and damnable investing environment there’s ever been.
-
The market is in a dangerous bubble; now let’s talk about the following stocks you just have to chase because they’re cheap.
-
We all know there are bubbles galore. That’s called received monetary policy wisdom. And every time they assure in speech or testimony that an end is conceivable something conspires to pull them back in.
-
The latest policy maker “do as I do, rather than say” was caused by today’s eyebrow-raising decision by the BOJ to follow last week’s big discussion on steeper yield curves with a business-as-usual purchase of super-long Japanese Government Bonds.
-
We know the prices of most assets are hopelessly distorted, yet prudence has had a very high price.
-
For too long a time, traders got by figuring they could front-run (trust) quantitative easing and disregard the rest. That game is getting long in the tooth as monetary policy runs out of gas and policy-makers are trying, unsuccessfully, to play it by ear. But what to do in response?
-
No one knows and, as a result, a lot of important assets are confusingly and maddeningly trapped in tight, uninformative ranges. No one wants to buy, no one can afford to sell and nobody’s happy.
-
The only things moving are sideshows like Mexican peso, which have nothing to do with the global economy.
Given these uncertainties, I have to point out again the importance of using a sell stop discipline, because when this house of cards falls, things can get very ugly very fast.
2. ETFs in the Spotlight
In case you missed the announcement and description of this section, you can read it here again.
It features 10 broadly diversified ETFs from my HighVolume list as posted every Monday. Furthermore, they are screened for the lowest MaxDD% number meaning they have been showing better resistance to temporary sell offs than all others over the past year.
Here are the 10 candidates:
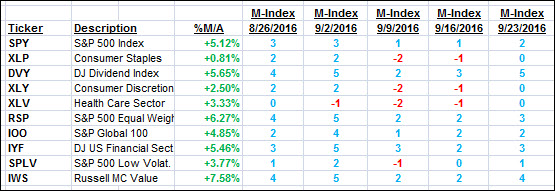
The above table simply demonstrates the magnitude with which some of the ETFs are fluctuating in regards to their positions above or below their respective individual trend lines (%M/A). A break below, represented by a negative number, shows weakness, while a break above, represented by a positive percentage, shows strength.
For hundreds of ETF choices, be sure to reference Thursday’s StatSheet.
Year to date, here’s how the above candidates have fared so far:
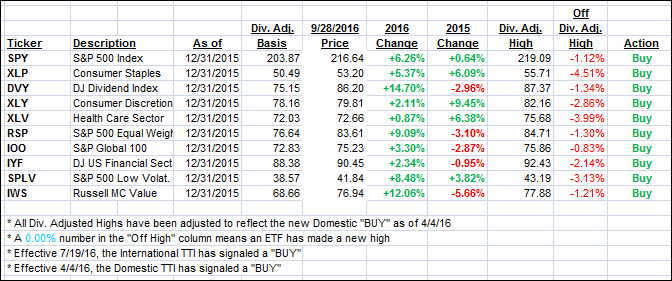
Again, the first table above shows the position of the various ETFs in relation to their respective long term trend lines (%M/A), while the second one tracks their trailing sell stops in the “Off High” column. The “Action” column will signal a “Sell” once the -7.5% point has been taken out in the “Off High” column.
3. Trend Tracking Indexes (TTIs)
Our Trend Tracking Indexes (TTIs) gained as an early sell-off reversed and pushed the major indexes above the unchanged line.
Here’s how we closed 9/28/2016:
Domestic TTI: +2.65% (last close +2.46%)—Buy signal effective 4/4/2016
International TTI: +5.00% (last close +4.37%)—Buy signal effective 7/19/2016
Disclosure: I am obliged to inform you that I, as well as my advisory clients, own some of the ETFs listed in the above table. Furthermore, they do not represent a specific investment recommendation for you, they merely show which ETFs from the universe I track are falling within the guidelines specified.
Contact Ulli