
1. Moving the Markets
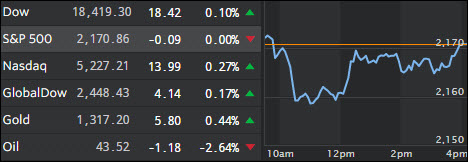
August was a quiet month for the U.S. stock market, with volatility at very low levels. The S&P 500 did not see a day with a change of 1% in either direction the entire month. However, a six-month winning streak was snapped in August for the Dow and, as you may know, we could be in for a bumpy ride this month due to the fact that September has historically been one of the worst months for blue-chip stocks.
Stocks did post a slight gain today ahead though ahead of a key jobs report on deck for Friday that could give great insight regarding the Fed’s next move on interest rates. On Wednesday, payroll processor ADP reported that private employers created 177,000 new jobs last month, topping forecasts by 2,000. That solid number could suggest a strong government employment report tomorrow with very likely the record being set for new part-time bartender and waitress jobs.
U.S. auto sales cooled off in August, which might be signaling that the industry may not break last year’s all-time record, despite a strong first half of the year. The auto industry has been hovering near 2015’s record pace of 17.5 million vehicles, fueled by allegedly strong employment, low gasoline prices and a solid housing market. Or, you could be more realistic and give credit to strong auto sales thanks to not only record subprime financing but also for periods up to 10 years.
And in big box retail, Walmart (WMT) announced today that it plans to shed about 7,000 store accounting and invoicing positions as the company moves to automate those processes. The company confirmed though that workers will be offered positions elsewhere in their stores.
2. ETFs in the Spotlight
In case you missed the announcement and description of this section, you can read it here again.
It features 10 broadly diversified ETFs from my HighVolume list as posted every Monday. Furthermore, they are screened for the lowest MaxDD% number meaning they have been showing better resistance to temporary sell offs than all others over the past year.
Here are the 10 candidates:
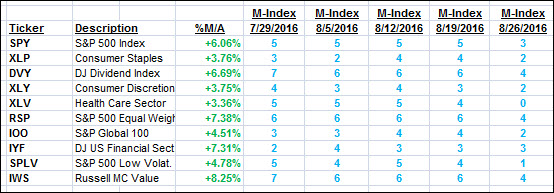
The above table simply demonstrates the magnitude with which some of the ETFs are fluctuating in regards to their positions above or below their respective individual trend lines (%M/A). A break below, represented by a negative number, shows weakness, while a break above, represented by a positive percentage, shows strength.
For hundreds of ETF choices, be sure to reference Thursday’s StatSheet.
Year to date, here’s how the above candidates have fared so far:
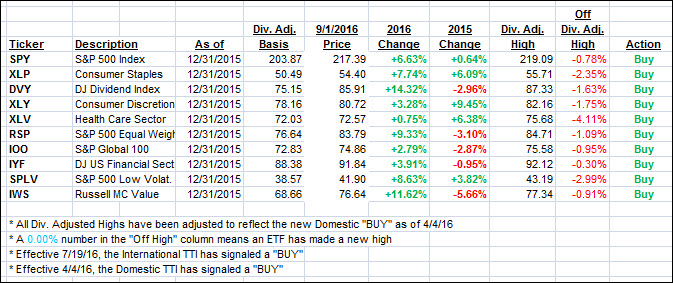
Again, the first table above shows the position of the various ETFs in relation to their respective long term trend lines (%M/A), while the second one tracks their trailing sell stops in the “Off High” column. The “Action” column will signal a “Sell” once the -7.5% point has been taken out in the “Off High” column.
3. Trend Tracking Indexes (TTIs)
Our Trend Tracking Indexes (TTIs) improved slightly despite the S&P 500 ending unchanged.
Here’s how we closed 9/1/2016:
Domestic TTI: +2.78% (last close +2.70%)—Buy signal effective 4/4/2016
International TTI: +4.70% (last close +4.32%)—Buy signal effective 7/19/2016
Disclosure: I am obliged to inform you that I, as well as my advisory clients, own some of the ETFs listed in the above table. Furthermore, they do not represent a specific investment recommendation for you, they merely show which ETFs from the universe I track are falling within the guidelines specified.
Contact Ulli