
1. Moving the Markets
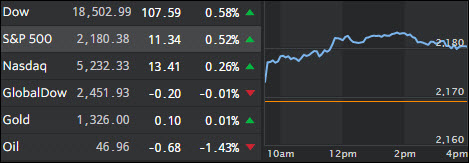
U.S. stocks closed higher Monday and the Dow broke a 3-day losing streak, even as investors continue to calculate the odds of a (potential) Federal Reserve interest-rate hike later this year.
Much of the focus throughout Wall Street has remained on the trajectory of interest rates, which have not increased for eight months, despite much speculation.
Federal Reserve Chair Janet Yellen said last Friday (in a highly-anticipated speech) that the case for an increase had “strengthened,” leaving open the door for an increase at the Fed’s September or December meetings. The ‘market moving’ event was already priced in apparently, given that the markets came out positive today.
From the world of retail: J. Crew’s vibrant collection of women’s wear will soon be available inside department store chain Nordstrom (JWN), as the struggling apparel brand looks for ways to get customers spending again. A partnership with Nordstrom aligns with the company’s customer service strategy of emphasizing design, quality and style, which appeals to most Nordstrom customers.
In energy, U.S. Crude Oil closed down slightly lower today at $46.95 a barrel, which remains well under the $50 a barrel cap that most analysts were projecting for the summer months. Now that the summer months are over, it shall be interesting to see not only how prices move throughout the fall but if the correlation with the S&P 500 is maintained.
2. ETFs in the Spotlight
In case you missed the announcement and description of this section, you can read it here again.
It features 10 broadly diversified ETFs from my HighVolume list as posted every Monday. Furthermore, they are screened for the lowest MaxDD% number meaning they have been showing better resistance to temporary sell offs than all others over the past year.
Here are the 10 candidates:
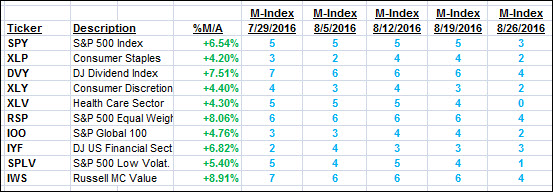
The above table simply demonstrates the magnitude with which some of the ETFs are fluctuating in regards to their positions above or below their respective individual trend lines (%M/A). A break below, represented by a negative number, shows weakness, while a break above, represented by a positive percentage, shows strength.
For hundreds of ETF choices, be sure to reference Thursday’s StatSheet.
Year to date, here’s how the above candidates have fared so far:
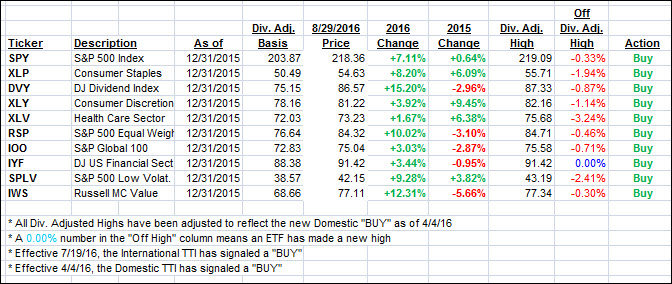
Again, the first table above shows the position of the various ETFs in relation to their respective long term trend lines (%M/A), while the second one tracks their trailing sell stops in the “Off High” column. The “Action” column will signal a “Sell” once the -7.5% point has been taken out in the “Off High” column.
3. Trend Tracking Indexes (TTIs)
Our Trend Tracking Indexes (TTIs) inched up a tad as the mjor indexes gained while the mood on Wall Street was one of ignoring the potential rate hike threat. The widely held view appears to be that the Fed is boxed in and in no position to increase rates. Let’s see how that plays out.
Here’s how we closed 8/29/2016:
Domestic TTI: +2.93% (last close +2.71%)—Buy signal effective 4/4/2016
International TTI: +4.50% (last close +4.27%)—Buy signal effective 7/19/2016
Disclosure: I am obliged to inform you that I, as well as my advisory clients, own some of the ETFs listed in the above table. Furthermore, they do not represent a specific investment recommendation for you, they merely show which ETFs from the universe I track are falling within the guidelines specified.
Contact Ulli