
1. Moving the Markets
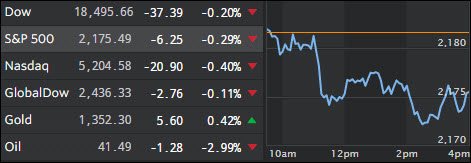
A combination of mixed earnings results and sliding crude prices along with a pullback in the US dollar pulled the major indexes off their lofty levels. Other domestic news contributing to this slippery day were fewer than expected job openings, while gold bucked the trend and rose modestly along with bonds.
As has been the case lately, volume has been atrocious making it questionable whether there is enough upside momentum left to continue towards record highs, especially when considering the lack of world-wide growth, weak corporate earnings and general concerns about the domestic economy.
However, not to worry, with the right combination of seducing headlines designed to trigger the computer algos into action, and some soothing words by the Fed about continued lower interest rates, we should be able to reach the S&P 500 2,200 level in no time, unless some sense of reality sets in all of a sudden with some analysts already having expressed fears that the markets are overvalued by some 30%; a fear which is certainly justified in my opinion.
2. ETFs in the Spotlight
In case you missed the announcement and description of this section, you can read it here again.
It features 10 broadly diversified ETFs from my HighVolume list as posted every Monday. Furthermore, they are screened for the lowest MaxDD% number meaning they have been showing better resistance to temporary sell offs than all others over the past year.
Here are the 10 candidates:
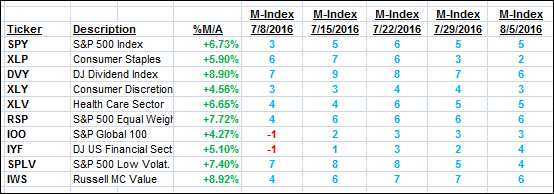
The above table simply demonstrates the magnitude with which some of the ETFs are fluctuating in regards to their positions above or below their respective individual trend lines (%M/A). A break below, represented by a negative number, shows weakness, while a break above, represented by a positive percentage, shows strength.
For hundreds of ETF choices, be sure to reference Thursday’s StatSheet.
Year to date, here’s how the above candidates have fared so far:
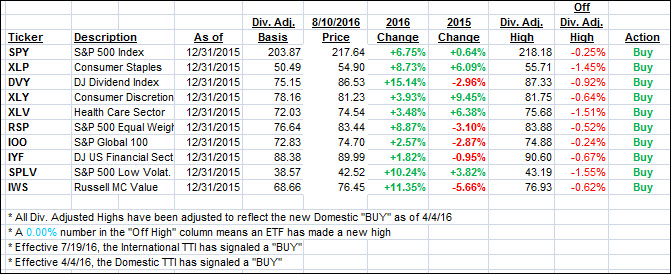
Again, the first table above shows the position of the various ETFs in relation to their respective long term trend lines (%M/A), while the second one tracks their trailing sell stops in the “Off High” column. The “Action” column will signal a “Sell” once the -7.5% point has been taken out in the “Off High” column.
3. Trend Tracking Indexes (TTIs)
Our Trend Tracking Indexes (TTIs) changed only slightly as the major indexes were pulled off their highs by weakening oil prices.
Here’s how we ended up on 8/10/2016:
Domestic TTI: +3.07% (last close +3.09%)—Buy signal effective 4/4/2016
International TTI: +4.28% (last close +4.18%)—Buy signal effective 7/19/2016
Disclosure: I am obliged to inform you that I, as well as my advisory clients, own some of the ETFs listed in the above table. Furthermore, they do not represent a specific investment recommendation for you, they merely show which ETFs from the universe I track are falling within the guidelines specified.
Contact Ulli