
1. Moving the Markets
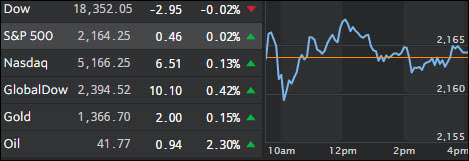
Swinging aimlessly above and below the unchanged line was the theme of the day for the major indexes despite oil shifting into high gear again by gaining 2.3%. There was obvious caution ahead of tomorrow’s Labor report but Treasuries were higher as jobless claims rose while factory orders dropped. Both, the US dollar and gold edged up.
European equities closed up as financials took the lead powered by the Bank of England’s (BoE) benchmark interest rate cut from 0.5% to 0.25%. That, for the time being, put the worries about the ongoing Italian banking crisis on the back burner, but I am sure it will surface again in the not too distant future.
From time to time I feature charts comparing the highly disconnected S&P 500 to underlying realities as presented by real numbers such as GDP, Earnings as measured by GAAP and others. Thanks to ZH, here is another long-term one showing the S&P 500 vs. US factory orders. Take a peek:
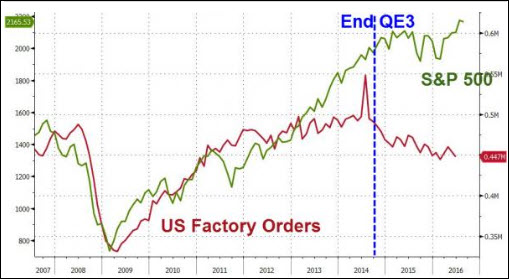
If you look at the scale on the left, you can see that a fair value for the S&P 500 would be in the 1,400 range, which is pretty much what some of the other graphs mentioned above are confirming. There is no doubt in my mind that we will get there eventually; the timing of it remains the big unknown.
2. ETFs in the Spotlight
In case you missed the announcement and description of this section, you can read it here again.
It features 10 broadly diversified ETFs from my HighVolume list as posted every Monday. Furthermore, they are screened for the lowest MaxDD% number meaning they have been showing better resistance to temporary sell offs than all others over the past year.
Here are the 10 candidates:
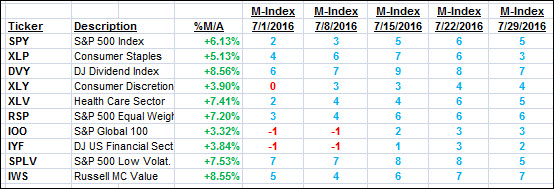
The above table simply demonstrates the magnitude with which some of the ETFs are fluctuating in regards to their positions above or below their respective individual trend lines (%M/A). A break below, represented by a negative number, shows weakness, while a break above, represented by a positive percentage, shows strength.
For hundreds of ETF/Mutual fund choices, be sure to reference Thursday’s StatSheet.
Year to date, here’s how the above candidates have fared so far:
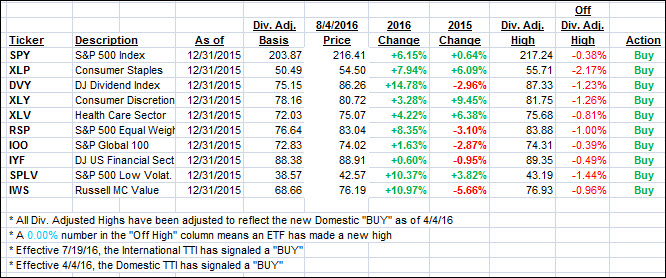
Again, the first table above shows the position of the various ETFs in relation to their respective long term trend lines (%M/A), while the second one tracks their trailing sell stops in the “Off High” column. The “Action” column will signal a “Sell” once the -7.5% point has been taken out in the “Off High” column.
3. Trend Tracking Indexes (TTIs)
Both of our Trend Tracking Indexes (TTIs) inched up a tad as traders were cautious ahead of tomorrow’s Labor report.
Here’s how we closed 8/4/2016:
Domestic TTI: +3.04% (last close +2.94%)—Buy signal effective 4/4/2016
International TTI: +2.83% (last close +2.50%)—Buy signal effective 7/19/2016
Disclosure: I am obliged to inform you that I, as well as my advisory clients, own some of the ETFs listed in the above table. Furthermore, they do not represent a specific investment recommendation for you, they merely show which ETFs from the universe I track are falling within the guidelines specified.
Contact Ulli