
1. Moving the Markets
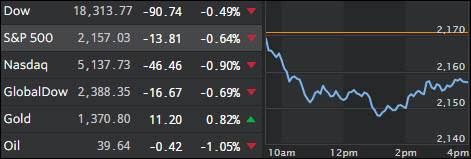
If you read yesterday’s commentary, you may remember me discussing the possibility that U.S. Crude oil could fall below $40 a barrel. Well, today it happened, which is completely opposite of how analysts were expecting the black gold to perform this summer. Many had pegged $50 per barrel as a mark that oil would surpass in the late summer months, but that has not been the case. Oversupply from Saudi Arabia, Iraq and the fact that the U.S. is increasing their rig count continues to be driving the price down and the time frame for when prices could turn upwards seems to get longer as each day passes.
In auto news, General Motors (GM) and Ford (F) posted U.S. sales declines in July, while Fiat Chrysler posted a small increase, as the U.S. automakers grapple with what appears to be a showroom plateau, albeit at record-high levels. Disappointed investors fled each automaker’s stock. Shares of both companies fell more than 4% on the day.
Europe contributed to part of the weakness in equities as the recent bank stress test was a total failure with the broad bank stock index now down some 7% from recent highs. Italian banks are hovering at records lows while behemoths like Deutsche Banks and Credit Suisse are being kicked out of the Stoxx 50 index as of this coming Monday. Right now, it appears that barring any sudden appearance of a suitor to bail out the European banking system, we may see more weakness in global equities.
2. ETFs in the Spotlight
In case you missed the announcement and description of this section, you can read it here again.
It features 10 broadly diversified ETFs from my HighVolume list as posted every Monday. Furthermore, they are screened for the lowest MaxDD% number meaning they have been showing better resistance to temporary sell offs than all others over the past year.
Here are the 10 candidates:
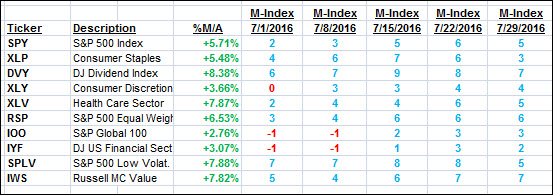
The above table simply demonstrates the magnitude with which some of the ETFs are fluctuating in regards to their positions above or below their respective individual trend lines (%M/A). A break below, represented by a negative number, shows weakness, while a break above, represented by a positive percentage, shows strength.
For hundreds of ETF/Mutual fund choices, be sure to reference Thursday’s StatSheet.
Year to date, here’s how the above candidates have fared so far:
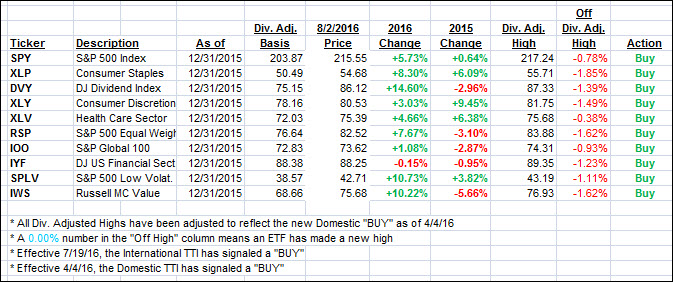
Again, the first table above shows the position of the various ETFs in relation to their respective long term trend lines (%M/A), while the second one tracks their trailing sell stops in the “Off High” column. The “Action” column will signal a “Sell” once the -7.5% point has been taken out in the “Off High” column.
3. Trend Tracking Indexes (TTIs)
Both of our Trend Tracking Indexes (TTIs) headed south as U.S. and European markets sold off in part due to the accelerating banking crisis in Italy and negative news reports on Deutsche Bank and Credit Suisse.
Here’s how we closed 8/2/2016:
Domestic TTI: +2.78% (last close +3.10%)—Buy signal effective 4/4/2016
International TTI: +2.30% (last close +3.31%)—Buy signal effective 7/19/2016
Disclosure: I am obliged to inform you that I, as well as my advisory clients, own some of the ETFs listed in the above table. Furthermore, they do not represent a specific investment recommendation for you, they merely show which ETFs from the universe I track are falling within the guidelines specified.
Contact Ulli