
1. Moving the Markets
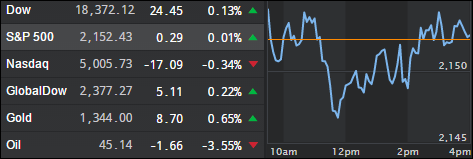
The U.S. stock market, which is now enjoying its second-longest bull run ever, closed lower today despite decent reports on the U.S. economy. While some Wall Street pros say the recent surge has put stocks temporarily in an overbought state, the general consensus is that the bull is alive and well and will post further gains as the breakout continues unless reality with underlying fundamentals sets in.
The Fed stated today that the U.S. economy picked up modestly in late May and June as the recovering housing market underpinned growth while the beleaguered manufacturing sector improved somewhat. Surprisingly, the summary said that employment continued to grow modestly despite the 287,000 June job gains reported by the Labor Department last week.
Manufacturing has been the biggest blemish on the economy for well over a year as weakness overseas and a strong dollar curtailed exports, and low oil prices have dampened investment in the energy sector. Commercial real estate sales and leasing also was stable or improved the Fed said.
2. ETFs in the Spotlight
In case you missed the announcement and description of this section, you can read it here again.
It features 10 broadly diversified ETFs from my HighVolume list as posted every Monday. Furthermore, they are screened for the lowest MaxDD% number meaning they have been showing better resistance to temporary sell offs than all others over the past year.
Here are the 10 candidates:
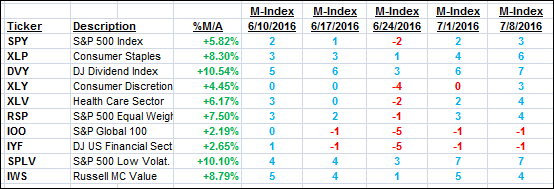
The above table simply demonstrates the magnitude with which some of the ETFs are fluctuating in regards to their positions above or below their respective individual trend lines (%M/A). A break below, represented by a negative number, shows weakness, while a break above, represented by a positive percentage, shows strength.
For hundreds of ETF/Mutual fund choices, be sure to reference Thursday’s StatSheet.
Year to date, here’s how the above candidates have fared so far:
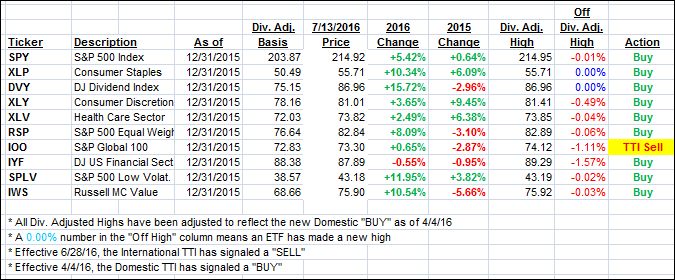
Again, the first table above shows the position of the various ETFs in relation to their respective long term trend lines (%M/A), while the second one tracks their trailing sell stops in the “Off High” column. The “Action” column will signal a “Sell” once the -7.5% point has been taken out in the “Off High” column.
3. Trend Tracking Indexes (TTIs)
Our Domestic Trend Tracking Index (TTI) pulled back a tad as the major indexes went predominantly sideways.
As I said yesterday, I will wait for further staying power on the International TTI conquering bullish territory before considering the current bearish cycle to be over.
Here’s how we closed 7/13/16:
Domestic TTI: +2.64% (last close +2.70%)—Buy signal effective 4/4/2016
International TTI: +1.18% (last close +1.22%)—Sell signal effective 6/28/2016
Disclosure: I am obliged to inform you that I, as well as advisory clients of mine, own some of these listed ETFs. Furthermore, they do not represent a specific investment recommendation for you, they merely show which ETFs from the universe I track are falling within the guidelines specified.
Contact Ulli