
1. Moving the Markets
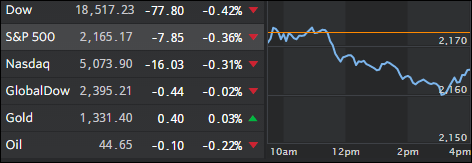
As you know, the Dow has been riding the bull for 9 day continued winning streak that hasn’t happened in three years. Unfortunately, that streak snapped today due to mixed earning reports here in the U.S. and an announcement from the European Central bank that they will hold off on additional stimulus following last month’s ‘Brexit’ vote.
The Dow, which notched its seventh straight record high Wednesday, was dragged down today by Intel (INTC), whose shares fell more than 4.3% after the company’s revenue fell short of estimates in its quarterly results released last night. Shares of American Express (AXP), another Dow component, were also trading 2.1% lower after a similar revenue miss.
In auto earnings news, we heard today that General Motors (GM) turned a profit of $2.9 billion in Q2, which easily surpassed Wall Street’s expectations. Notable drivers of sales growth were increased earnings in China and the Americans, whose citizens continued buying expensive trucks, sport-utility vehicles and crossovers.
On the economic front, existing home sales rose, jobless claims surprisingly contracted and the Leading Indicator topped forecasts. Crude oil and the U.S. dollar headed south while gold staged a nice rebound after showing weakness during the past week.
2. ETFs in the Spotlight
In case you missed the announcement and description of this section, you can read it here again.
It features 10 broadly diversified ETFs from my HighVolume list as posted every Saturday. Furthermore, they are screened for the lowest MaxDD% number meaning they have been showing better resistance to temporary sell offs than all others over the past year.
Here are the 10 candidates:
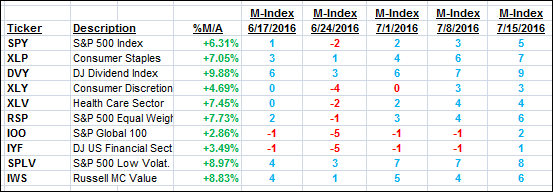
The above table simply demonstrates the magnitude with which some of the ETFs are fluctuating in regards to their positions above or below their respective individual trend lines (%M/A). A break below, represented by a negative number, shows weakness, while a break above, represented by a positive percentage, shows strength.
For hundreds of ETF/Mutual fund choices, be sure to reference Thursday’s StatSheet.
Year to date, here’s how the above candidates have fared so far:
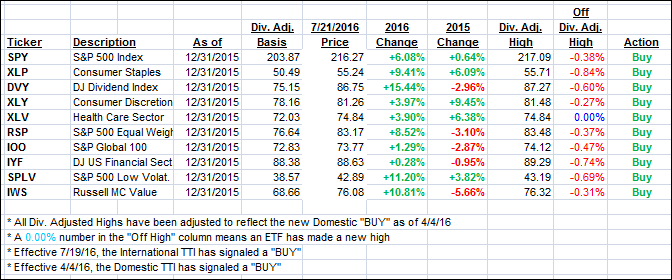
Again, the first table above shows the position of the various ETFs in relation to their respective long term trend lines (%M/A), while the second one tracks their trailing sell stops in the “Off High” column. The “Action” column will signal a “Sell” once the -7.5% point has been taken out in the “Off High” column.
3. Trend Tracking Indexes (TTIs)
Our Domestic Trend Tracking Index (TTI) retreated as the major indexes actually pulled back, although only by around 0.3%. The International TTI bucked the trend and closed up as you can see below.
Here’s how we ended up on 7/21/2016:
Domestic TTI: +2.73% (last close +2.89%)—Buy signal effective 4/4/2016
International TTI: +2.49% (last close +2.27%)—Buy signal effective 7/19/2016
Disclosure: I am obliged to inform you that I, as well as advisory clients of mine, own some of these listed ETFs. Furthermore, they do not represent a specific investment recommendation for you, they merely show which ETFs from the universe I track are falling within the guidelines specified.
Contact Ulli