
1. Moving the Markets
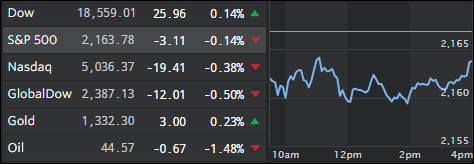
Stocks ended mixed today, apart from the Dow, which climbed for an eighth straight day and notched a new closing high.
While the S&P 500 closed in the red today, don’t forget that the index is coming off another record high recently, and both the S&P 500 and the Dow are now up more than 6% for the year.
Second quarter earnings season is fully underway and we heard from some big market movers today. Goldman Sachs (GS), Johnson & Johnson (JNJ), IBM (IBM) and United Healthcare (UNH) all posted numbers that beat sharply reduced earnings expectations.
Shares of Goldman Sachs, which topped analyst forecasts by nearly 70 cents per share, fell 1.3%. J&J stock, which also topped analyst forecasts rose 1.7% higher and IBM slid lower after solid earnings. This begs the question as to just how much share price movement is really tied to earnings reports…
One of the big entertainment market movers, Netflix (NFLX), missed big on its earnings report and shares of the stock fell accordingly, -13% approximately. The company only added 1.7 million new subscribers from April through June, which was significantly below the 2.5 million they were expecting. The company blamed their lackluster numbers on people cancelling their memberships at a higher rate than expected.
2. ETFs in the Spotlight
In case you missed the announcement and description of this section, you can read it here again.
It features 10 broadly diversified ETFs from my HighVolume list as posted every Monday. Furthermore, they are screened for the lowest MaxDD% number meaning they have been showing better resistance to temporary sell offs than all others over the past year.
Here are the 10 candidates:
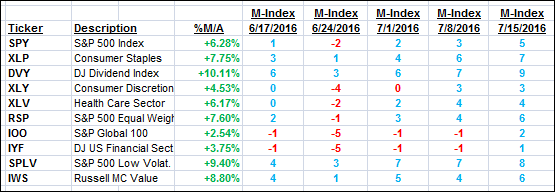
The above table simply demonstrates the magnitude with which some of the ETFs are fluctuating in regards to their positions above or below their respective individual trend lines (%M/A). A break below, represented by a negative number, shows weakness, while a break above, represented by a positive percentage, shows strength.
For hundreds of ETF/Mutual fund choices, be sure to reference Thursday’s StatSheet.
Year to date, here’s how the above candidates have fared so far:
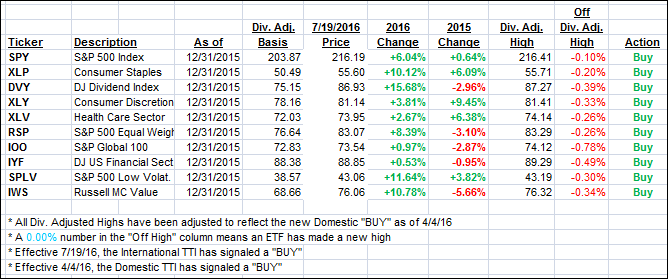
Again, the first table above shows the position of the various ETFs in relation to their respective long term trend lines (%M/A), while the second one tracks their trailing sell stops in the “Off High” column. The “Action” column will signal a “Sell” once the -7.5% point has been taken out in the “Off High” column.
3. Trend Tracking Indexes (TTIs)
Our Domestic Trend Tracking Index (TTI) slipped along with the International one as the major indexes stayed mainly below the unchanged line.
Here’s how we closed 7/19/2016:
Domestic TTI: +2.64% (last close +2.71%)—Buy signal effective 4/4/2016
International TTI: +1.74% (last close +2.10%)—Buy signal effective 7/19/2016
Disclosure: I am obliged to inform you that I, as well as advisory clients of mine, own some of these listed ETFs. Furthermore, they do not represent a specific investment recommendation for you, they merely show which ETFs from the universe I track are falling within the guidelines specified.
Contact Ulli