
1. Moving the Markets
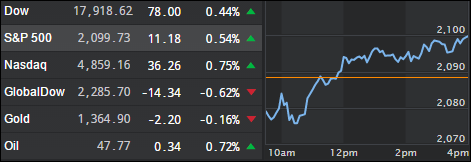
Stocks here in the U.S. brushed off early losses, despite a global sell-off, to end higher today. U.S. government bond yields bounced back from fresh record lows amid continued market turbulence following the surprise Brexit vote two weeks ago.
Yesterday and early today, it seemed that investors were reconsidering the implications of the British exit. Markets were sagging to say the least; however, the bulls turned their horns up mid-morning and the gains plowed forward in the afternoon after a release of the minutes from the Federal Reserve’s last policy meeting showed the central bank is in no hurry to raise interest rates. Translated, that means that low interest rates are here to stay for a long time, and markets are now encouraged to make new all-time highs possibly by next Tuesday. Of course, I am being facetious…
Fed officials did not provide a timetable for future increases, according to minutes of the Fed’s June 14-15 meeting. But they did indicate that their decisions could play out over “coming months” and that they must review a range of positive data before acting again.
U.S. crude oil also bounced back today, gaining 2.85% to close at $47.93 a barrel. Many analysts were speculating that crude would push (and stay) above the $50 a barrel mark during the summer months, but that has yet to happen.
2. ETFs in the Spotlight
In case you missed the announcement and description of this section, you can read it here again.
It features 10 broadly diversified ETFs from my HighVolume list as posted every Monday. Furthermore, they are screened for the lowest MaxDD% number meaning they have been showing better resistance to temporary sell offs than all others over the past year.
Here are the 10 candidates:
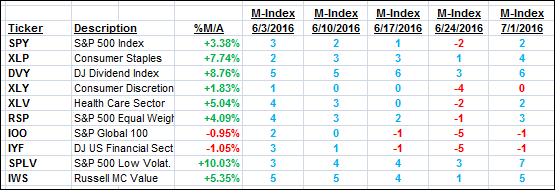
The above table simply demonstrates the magnitude with which some of the ETFs are fluctuating in regards to their positions above or below their respective individual trend lines (%M/A). A break below, represented by a negative number, shows weakness, while a break above, represented by a positive percentage, shows strength.
For hundreds of ETF/Mutual fund choices, be sure to reference Thursday’s StatSheet.
Year to date, here’s how the above candidates have fared so far:
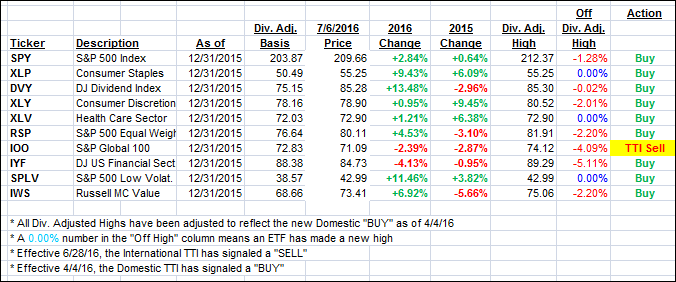
Again, the first table above shows the position of the various ETFs in relation to their respective long term trend lines (%M/A), while the second one tracks their trailing sell stops in the “Off High” column. The “Action” column will signal a “Sell” once the -7.5% point has been taken out in the “Off High” column.
3. Trend Tracking Indexes (TTIs)
Our Domestic Trend Tracking Index (TTI) headed higher while the International one slipped deeper into bearish territory as the implosion of the Italian banking system gained momentum. If that scenario worsens and no acceptable bailout solution is found, you can be sure that the fallout will be felt around the world.
Here’s how we closed:
Domestic TTI: +1.84% (last close +1.66%)—Buy signal effective 4/4/2016
International TTI: -2.29% (last close -2.00%)—Sell signal effective 6/28/2016
Disclosure: I am obliged to inform you that I, as well as advisory clients of mine, own some of these listed ETFs. Furthermore, they do not represent a specific investment recommendation for you, they merely show which ETFs from the universe I track are falling within the guidelines specified.
Contact Ulli