
1. Moving the Markets
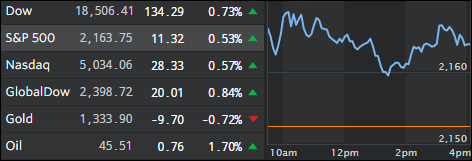
The Dow and S&P 500 indexes moved higher Thursday, pushing further into record territory as investors (domestic and abroad) reacted to a positive earnings report from JPMorgan (JPM) and continued to price in/hope for further stimulus from global central bankers despite interest rates remaining at depression levels.
Investors got a boost from a strong earnings report from JPMorgan (JPM), the nation’s second largest bank by assets. The closely watched bank reported Q2 earnings per share of $1.55, which surpassed the $1.43 analysts had expected. Revenue also topped expectations and shares jumped more than 1.5% on the day.
Wall Street was also reacting to a decision by the Bank of England to keep its benchmark interest rate unchanged at 0.5%. It was the first meeting of the BOE following the June 23 vote by Britain to exit the European Union, and investors were expecting a quarter-point rate cut. Still, the BOE said it expects “monetary policy to be loosened in August,” when it meets again.
Stocks around the globe have rallied sharply in the aftermath of the so-called Brexit vote. Again, the rebound rally has been driven in large part by a realization that global central bankers will further stimulate economies to offset the fallout and uncertainty caused by Britain’s surprise vote to leave the single-market European Union. At least that is the convenient excuse that will be used many times over, especially if a severe market pullback materializes.
2. ETFs in the Spotlight
In case you missed the announcement and description of this section, you can read it here again.
It features 10 broadly diversified ETFs from my HighVolume list as posted every Monday. Furthermore, they are screened for the lowest MaxDD% number meaning they have been showing better resistance to temporary sell offs than all others over the past year.
Here are the 10 candidates:
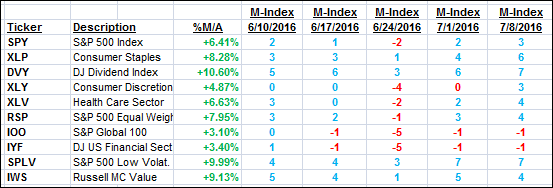
The above table simply demonstrates the magnitude with which some of the ETFs are fluctuating in regards to their positions above or below their respective individual trend lines (%M/A). A break below, represented by a negative number, shows weakness, while a break above, represented by a positive percentage, shows strength.
For hundreds of ETF/Mutual fund choices, be sure to reference Thursday’s StatSheet.
Year to date, here’s how the above candidates have fared so far:
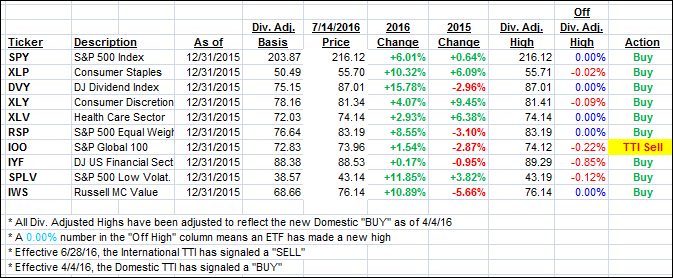
Again, the first table above shows the position of the various ETFs in relation to their respective long term trend lines (%M/A), while the second one tracks their trailing sell stops in the “Off High” column. The “Action” column will signal a “Sell” once the -7.5% point has been taken out in the “Off High” column.
3. Trend Tracking Indexes (TTIs)
Our Domestic Trend Tracking Index (TTI) inched up a tad as the International one jumped. We’ve seen this movie before, so I will wait for further staying power above the line on the International TTI before considering the current bearish cycle to be over.
Here’s how we closed 7/14/16:
Domestic TTI: +2.78% (last close +2.64%)—Buy signal effective 4/4/2016
International TTI: +1.80% (last close +1.18%)—Sell signal effective 6/28/2016
Disclosure: I am obliged to inform you that I, as well as advisory clients of mine, own some of these listed ETFs. Furthermore, they do not represent a specific investment recommendation for you, they merely show which ETFs from the universe I track are falling within the guidelines specified.
Contact Ulli
Comments 2
Your dead cat bounced pretty high. Looks to me like you’re hedging your bets, Uli.
Yes, that’s what you need to do when your are in a market environment that is manipulated by the Central Banks in a way that we have never seen before.
Ulli…