
1. Moving the Markets
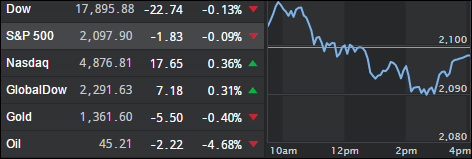
Stocks on Wall Street ended mixed despite a solid report on employment and a big proposed deal in the food sector.
Paris-based Danone, maker of Dannon yogurt, agreed to acquire organic food provider WhiteWave Foods (WWAV) for $56.25 based on a valuation of 26x cash flow, which equates to an enterprise value of about $12.5 billion. The acquisition will double the size of Danone’s U.S. business. The stock gained 18.55% to close at $56.23 a share on the day. The transaction is expected to close by the end of the year and is subject to approval from regulators and WhiteWave’s shareholders.
In a sign that risk-aversion may be temporarily diminishing, the British pound was up nearly 0.7% vs. the dollar. But the price of a barrel of U.S.-produced crude got hammered -4.66% to $45.22. Crude took a hit after the government reported that U.S. crude inventories shrank less than expected in the past week.
Businesses added 172,000 jobs in June, said payroll processor ADP, in a sign that the government’s employment report may show at least a moderate rebound after two dreary showings.
Wall Street will be looking ahead to tomorrow’s June jobs report, which could shed light on the strength of the U.S. labor market following two straight months of disappointing job growth.
2. ETFs in the Spotlight
In case you missed the announcement and description of this section, you can read it here again.
It features 10 broadly diversified ETFs from my HighVolume list as posted every Monday. Furthermore, they are screened for the lowest MaxDD% number meaning they have been showing better resistance to temporary sell offs than all others over the past year.
Here are the 10 candidates:
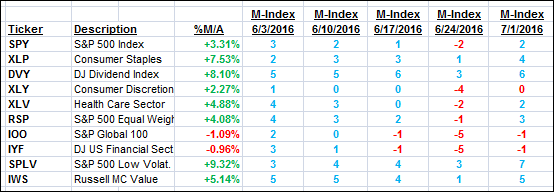
The above table simply demonstrates the magnitude with which some of the ETFs are fluctuating in regards to their positions above or below their respective individual trend lines (%M/A). A break below, represented by a negative number, shows weakness, while a break above, represented by a positive percentage, shows strength.
For hundreds of ETF/Mutual fund choices, be sure to reference Thursday’s StatSheet.
Year to date, here’s how the above candidates have fared so far:
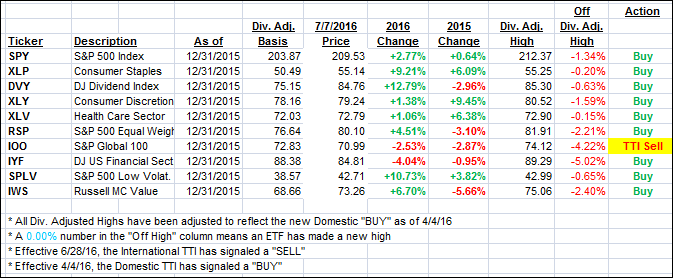
Again, the first table above shows the position of the various ETFs in relation to their respective long term trend lines (%M/A), while the second one tracks their trailing sell stops in the “Off High” column. The “Action” column will signal a “Sell” once the -7.5% point has been taken out in the “Off High” column.
3. Trend Tracking Indexes (TTIs)
Our Domestic Trend Tracking Index (TTI) barely changed just like its International cousin as the major indexes were churning above and below their unchanged line in anticipation of tomorrow’s jobs report.
Here’s how we ended up:
Domestic TTI: +1.88% (last close +1.84%)—Buy signal effective 4/4/2016
International TTI: -2.09% (last close -2.29%)—Sell signal effective 6/28/2016
Disclosure: I am obliged to inform you that I, as well as advisory clients of mine, own some of these listed ETFs. Furthermore, they do not represent a specific investment recommendation for you, they merely show which ETFs from the universe I track are falling within the guidelines specified.
Contact Ulli