
1. Moving the Markets
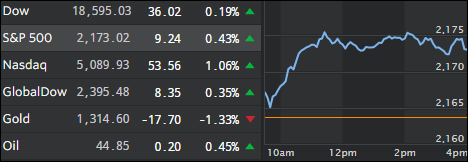
The Dow continued blazing a trail today, bolstered by a strong earnings report from tech giant Microsoft (MSFT). The index continues to plow its way into record territory and lately there’s no sign of it doing otherwise. The nine-day winning streak is its longest since a 10-session rally more than three years ago in March 2013.
The Dow and S&P 500 have been moving higher in the past week due to a better-than-expected start to Q2 earnings season, which, of course, was based on sharply reduced expectations to begin with to make the actual numbers look better. This rally is hardly based on improving economic fundamentals but more so a function of central bank intervention to keep the dream of a recovery alive. After all, if that was not so, why would bond yields signal a recession in the making? As a result, the continued Bull Run is merely a reflection of investor optimism that central bankers (CBs) around the world will continue to support the markets with fiscal stimulus. Once either optimism or CB support ends, watch out below!
Microsoft’s earnings report blew the hats off of investors as it surpassed profit estimates by 16 cents per share. The strong results from the tech giant, which is best known for its software, were more correlated to this quarter’s strong performance from its cloud computing division. Shares gained 5.3% on the day.
Morgan Stanley (MS) also bested expectations today via both profit and revenue results. Shares closed 2.1% higher.
2. ETFs in the Spotlight
In case you missed the announcement and description of this section, you can read it here again.
It features 10 broadly diversified ETFs from my HighVolume list as posted every Saturday. Furthermore, they are screened for the lowest MaxDD% number meaning they have been showing better resistance to temporary sell offs than all others over the past year.
Here are the 10 candidates:
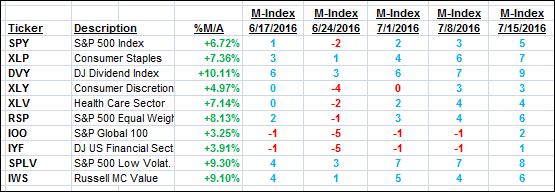
The above table simply demonstrates the magnitude with which some of the ETFs are fluctuating in regards to their positions above or below their respective individual trend lines (%M/A). A break below, represented by a negative number, shows weakness, while a break above, represented by a positive percentage, shows strength.
For hundreds of ETF/Mutual fund choices, be sure to reference Thursday’s StatSheet.
Year to date, here’s how the above candidates have fared so far:
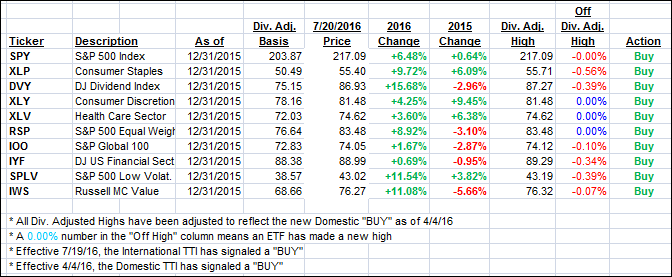
Again, the first table above shows the position of the various ETFs in relation to their respective long term trend lines (%M/A), while the second one tracks their trailing sell stops in the “Off High” column. The “Action” column will signal a “Sell” once the -7.5% point has been taken out in the “Off High” column.
3. Trend Tracking Indexes (TTIs)
Our Domestic Trend Tracking Index (TTI) headed north along with the International one, which jumped sharply.
Here’s how we closed 7/20/2016:
Domestic TTI: +2.89% (last close +2.64%)—Buy signal effective 4/4/2016
International TTI: +2.27% (last close +1.74%)—Buy signal effective 7/19/2016
Disclosure: I am obliged to inform you that I, as well as advisory clients of mine, own some of these listed ETFs. Furthermore, they do not represent a specific investment recommendation for you, they merely show which ETFs from the universe I track are falling within the guidelines specified.
Contact Ulli