
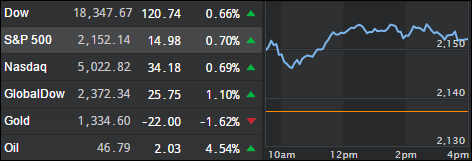
1. Moving the Markets
One record setting day this week wasn’t enough for Wall Street it seems. Yesterday, the S&P 500 passed its high water mark and obviously impressed investors, but the Dow got jealous and joined the S&P 500 in taking out its 2015 all-time high and moving into previously untouched territory.
Some are asking themselves, how is this bull market different from the 2015 bull market? Well, the market might look like a bull party, but beneath the surface, investors are playing it much safer than they did in 2015. Stable and high-yielding stocks like utilities, real-estate investment trusts and energy are the best performing asset classes this year. That’s completely different from May 2015, when the leading stocks were risky investments like biotech, consumer discretionary and technology stocks. Still, keep in mind this does not change the fact that this rally is built on nothing but hope for more stimulus by the central banks and is not based on improving fundamentals.
As I mentioned last week, Alcoa (AA) was set to kick of Q2 earnings season this week. They reported after the bell Monday and shares gained more than 5% today after the aluminum giant reported better-than-expected results. Overall, the news from corporates here in the U.S. is not expected to be good, with analysts estimating S&P 500 company profits will be down 5.2% overall from a year earlier. Again, none of this matters as long as the Fed is your friend and remains accommodative. Until—one day—the bottom drops out.
2. ETFs in the Spotlight
In case you missed the announcement and description of this section, you can read it here again.
It features 10 broadly diversified ETFs from my HighVolume list as posted every Monday. Furthermore, they are screened for the lowest MaxDD% number meaning they have been showing better resistance to temporary sell offs than all others over the past year.
Here are the 10 candidates:
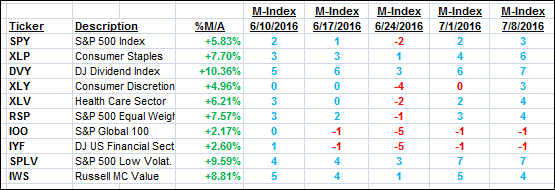
The above table simply demonstrates the magnitude with which some of the ETFs are fluctuating in regards to their positions above or below their respective individual trend lines (%M/A). A break below, represented by a negative number, shows weakness, while a break above, represented by a positive percentage, shows strength.
For hundreds of ETF/Mutual fund choices, be sure to reference Thursday’s StatSheet.
Year to date, here’s how the above candidates have fared so far:
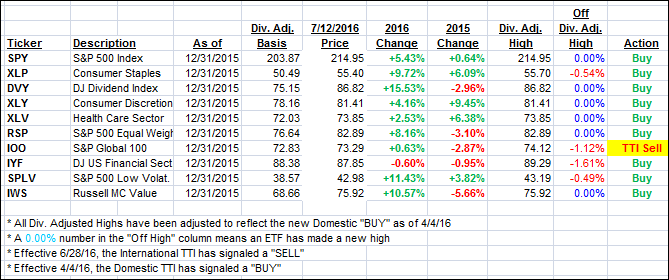
Again, the first table above shows the position of the various ETFs in relation to their respective long term trend lines (%M/A), while the second one tracks their trailing sell stops in the “Off High” column. The “Action” column will signal a “Sell” once the -7.5% point has been taken out in the “Off High” column.
3. Trend Tracking Indexes (TTIs)
Our Domestic Trend Tracking Index (TTI) edged up, while the International one jumped and close on the bullish side of its trend line for the second day in a row. We’ve seen this trend line dance before, so I will wait for further confirmation before considering the current bearish cycle to be over.
Here’s how we ended this day:
Domestic TTI: +2.70% (last close +2.53%)—Buy signal effective 4/4/2016
International TTI: +1.22% (last close +0.10%)—Sell signal effective 6/28/2016
Disclosure: I am obliged to inform you that I, as well as advisory clients of mine, own some of these listed ETFs. Furthermore, they do not represent a specific investment recommendation for you, they merely show which ETFs from the universe I track are falling within the guidelines specified.
Contact Ulli