
1. Moving the Markets
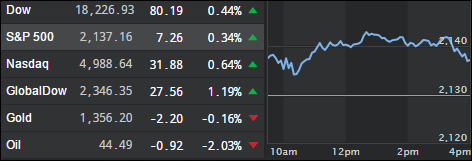
Friday’s rally following the 287k jobs number, which was only impressive on the surface, continued into Monday as traders considered the current situation a Goldilocks scenario. Because there is continued uncertainty about the fallout from the Brexit vote, the higher than expected jobs number is not seen as a signal that the Fed might be raising rates in the near future, hence we have unbridled optimism.
Helping equities was the fact that Japan’s PM Abe won his election with his ruling coalition over the weekend and his now having two-thirds majority in their upper house giving him the power to push through possibly the mother of all stimulus programs. Not by coincidence, I am sure, former Fed chair Bernanke has been meeting with Abe and rumor has it that even the theme of “Helicopter money” will be discussed.
That’s all it took, and the the Nikkei shifted into overdrive by gaining almost 4% on the day with momentum flowing into the U.S. markets at the opening. European equities gained as as well despite the fact that their banking system is in danger of collapsing with Italian banks being the center of attention followed by Deutsche Bank.
But then again, who cares about these little inconveniences when major stimulus programs can drive equity markets higher no matter what. Case in point today was the Nasdaq, which pierced through its 5,000 level but failed to hold it. If you look at the chart below, it simply does not make sense:
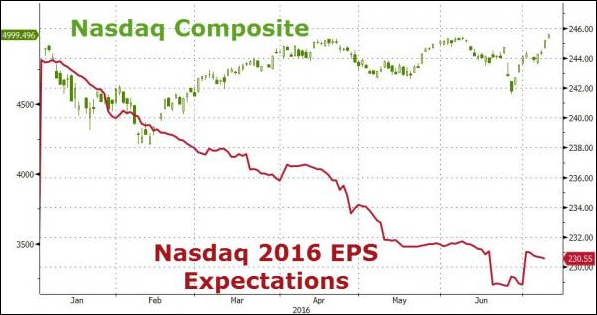
As has been the case lately, volume was very low, which makes this rally suspect. None of this matters; until one day it does.
2. ETFs in the Spotlight
In case you missed the announcement and description of this section, you can read it here again.
It features 10 broadly diversified ETFs from my HighVolume list as posted every Monday. Furthermore, they are screened for the lowest MaxDD% number meaning they have been showing better resistance to temporary sell offs than all others over the past year.
Here are the 10 candidates:
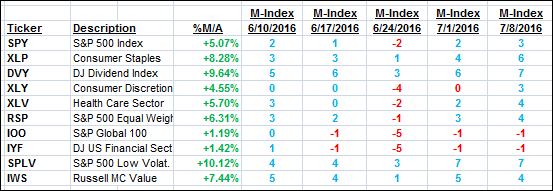
The above table simply demonstrates the magnitude with which some of the ETFs are fluctuating in regards to their positions above or below their respective individual trend lines (%M/A). A break below, represented by a negative number, shows weakness, while a break above, represented by a positive percentage, shows strength.
For hundreds of ETF/Mutual fund choices, be sure to reference Thursday’s StatSheet.
Year to date, here’s how the above candidates have fared so far:
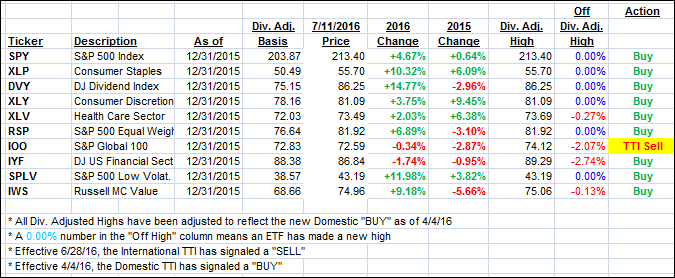
Again, the first table above shows the position of the various ETFs in relation to their respective long term trend lines (%M/A), while the second one tracks their trailing sell stops in the “Off High” column. The “Action” column will signal a “Sell” once the -7.5% point has been taken out in the “Off High” column.
3. Trend Tracking Indexes (TTIs)
Our Domestic Trend Tracking Index (TTI) inched higher, while its International cousin managed to break above its long-term trend line by a fraction of a percent. Again, I will need to see more of a break along with some staying power before considering this a new Buy signal.
Here’s how we closed today:
Domestic TTI: +2.53% (last close +2.42%)—Buy signal effective 4/4/2016
International TTI: +0.10% (last close -0.77%)—Sell signal effective 6/28/2016
Disclosure: I am obliged to inform you that I, as well as advisory clients of mine, own some of these listed ETFs. Furthermore, they do not represent a specific investment recommendation for you, they merely show which ETFs from the universe I track are falling within the guidelines specified.
Contact Ulli