
1. Moving the Markets
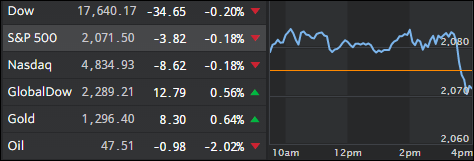
Despite talking out of both sides of its mouth for weeks, the Federal Reserve announced at the close of its meeting today that it would keep interest rates unchanged. While commenting on the matter though, Yellen said a July hike “is not impossible,” suggesting that strong job growth in June and substantial upward revisions of May’s feeble gains could embolden the Fed to act soon. Sure, we’ve heard this same song for a long time.
One commodity though that has been basking in the sun of rate hike stalls is Gold.
Gold hit a six-week high today, climbing for the sixth straight session after the Fed lowered its economic growth forecasts through 2017. The metal is highly sensitive to U.S. interest rates, increases in which lift the opportunity cost of holding non-yielding gold and boost the dollar, upon which gold is priced.Yesterday, holdings in the SPDR Gold Trust (GLD), the world’s largest gold-backed exchange-traded fund, rose to its highest level since October 2013 and there are no signs of it slowing down.
The economy, meanwhile, has sloshing along after notching meager growth the past two quarters. Consumer spending, which makes up 70% of economic activity, has picked up a tad and while the housing recovery has gained steam, signs of a top appear on the horizon. Exports and business investment remain feeble because of weakness abroad, a strong dollar and the oil industry downturn.
2. ETFs in the Spotlight
In case you missed the announcement and description of this section, you can read it here again.
It features 10 broadly diversified ETFs from my HighVolume list as posted every Monday. Furthermore, they are screened for the lowest MaxDD% number meaning they have been showing better resistance to temporary sell offs than all others over the past year.
Here are the 10 candidates:
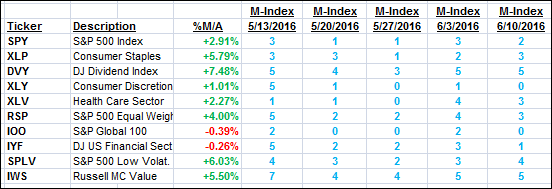
The above table simply demonstrates the magnitude with which some of the ETFs are fluctuating in regards to their positions above or below their respective individual trend lines (%M/A). A break below, represented by a negative number, shows weakness, while a break above, represented by a positive percentage, shows strength.
For hundreds of ETF/Mutual fund choices, be sure to reference Thursday’s StatSheet.
Year to date, here’s how the above candidates have fared so far:
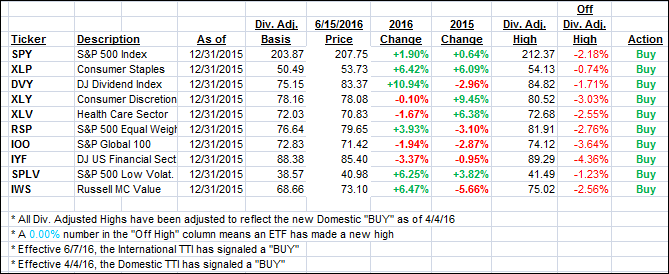
Again, the first table above shows the position of the various ETFs in relation to their respective long term trend lines (%M/A), while the second one tracks their trailing sell stops in the “Off High” column. The “Action” column will signal a “Sell” once the -7.5% point has been taken out in the “Off High” column.
3. Trend Tracking Indexes (TTIs)
Our Domestic Trend Tracking Index (TTI) inched up a tad, while the International one improved as well. As I said yesterday “I will give it another couple of days to see if there is any improvement before pulling the trigger on what appears to be the latest International whip-saw signal.”
Here’s how we ended up today:
Domestic TTI: +1.63% (last close +1.61%)—Buy signal effective 4/4/2016
International TTI: -1.40% (last close -1.87%)—Buy signal effective 6/7/2016
Disclosure: I am obliged to inform you that I, as well as advisory clients of mine, own some of these listed ETFs. Furthermore, they do not represent a specific investment recommendation for you, they merely show which ETFs from the universe I track are falling within the guidelines specified.
Contact Ulli