
1. Moving the Markets
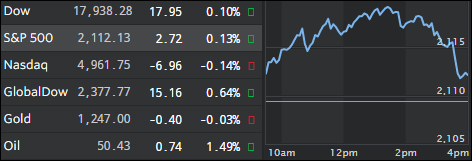
An early rally failed but left the major indexes near multi-months highs despite a late session pullback. It looks like the computer algos continue their push towards all-time highs on no news other than that oil not only climbed above the $50/bbl level but also closed there. The fly in the ointment was that volume was the lowest for the year 2016, which makes this rally suspect.
Investors continued to digest Fed chief Yellen’s remarks as to whether they might be at the verge of delaying the timing of future rate hikes because of last week’s horrific unemployment report. Eventually, Wall Street participants will have to realize that any delay of an interest rate hike is predominantly a function of a weak economy and a potential recession.
It means, as I have repeatedly posted, that the S&P 500, as the major benchmark index, is totally disconnected from underlying US Macro data. ZH featured an updated chart that posts the question “Who will be proven correct?” Take a look:
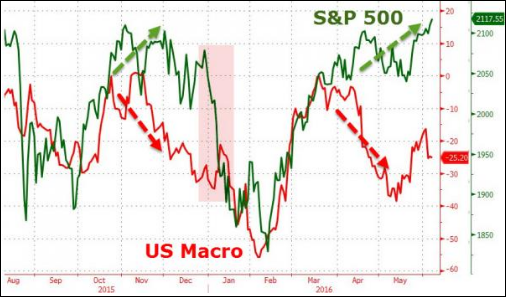
At this time, the S&P continues its move into nosebleed territory, but how long can that last? Sure, it could be a while longer validating the old adage that “markets can remain irrational a lot longer than you can remain solvent.” True words, but eventually reality will sink in.
2. ETFs in the Spotlight
In case you missed the announcement and description of this section, you can read it here again.
It features 10 broadly diversified ETFs from my HighVolume list as posted every Monday. Furthermore, they are screened for the lowest MaxDD% number meaning they have been showing better resistance to temporary sell offs than all others over the past year.
Here are the 10 candidates:
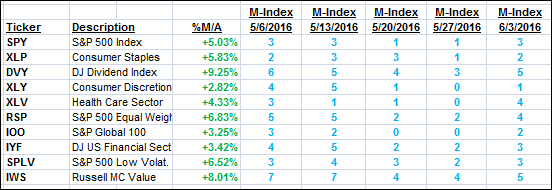
The above table simply demonstrates the magnitude with which some of the ETFs are fluctuating in regards to their positions above or below their respective individual trend lines (%M/A). A break below, represented by a negative number, shows weakness, while a break above, represented by a positive percentage, shows strength.
For hundreds of ETF/Mutual fund choices, be sure to reference Thursday’s StatSheet.
Year to date, here’s how the above candidates have fared so far:
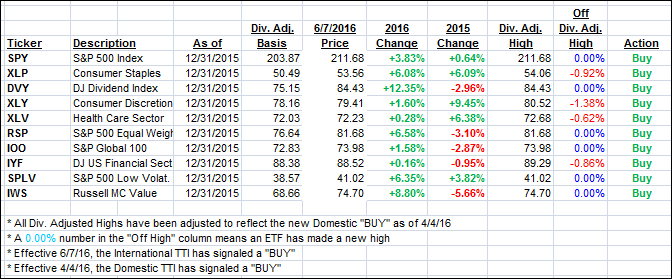
Again, the first table above shows the position of the various ETFs in relation to their respective long term trend lines (%M/A), while the second one tracks their trailing sell stops in the “Off High” column. The “Action” column will signal a “Sell” once the -7.5% point has been taken out in the “Off High” column.
3. Trend Tracking Indexes (TTIs)
Our Domestic Trend Tracking Index (TTI) inched up a tad while the International TTI jumped deeper into bullish territory validating our “Buy” signal for the time being.
Here’s how we closed:
Domestic TTI: +2.36% (last close +2.28%)—Buy signal effective 4/4/2016
International TTI: +2.32% (last close +1.73%)—Buy signal effective 6/7/2016
Disclosure: I am obliged to inform you that I, as well as advisory clients of mine, own some of these listed ETFs. Furthermore, they do not represent a specific investment recommendation for you, they merely show which ETFs from the universe I track are falling within the guidelines specified.
Contact Ulli