
1. Moving the Markets
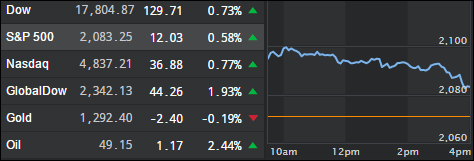
Worldwide stock markets staged a huge rally this morning, which smelled like a dead cat bounce to me, as the much anticipated Brexit vote polls seem to be heading in the other direction with “remain” polls allegedly surging over the weekend casting doubt on the “leave” camp’s leadership.
With the European Union being most affected by the outcome, it was therefore no surprise that some of the EU markets gained 3.5% on the day. US stocks were up over 1% at one point but, after Europe closed, it was all downhill from there. Nevertheless, the major indexes managed to stay on the plus side as the table above shows.
The vote is schedule to take place this coming Thursday and will be one of the most anticipated events in recent market history. No matter what the outcome, US markets will be affected as well, although most likely not to the same degree as Europe. Stay tuned.
2. ETFs in the Spotlight
In case you missed the announcement and description of this section, you can read it here again.
It features 10 broadly diversified ETFs from my HighVolume list as posted every Monday. Furthermore, they are screened for the lowest MaxDD% number meaning they have been showing better resistance to temporary sell offs than all others over the past year.
Here are the 10 candidates:
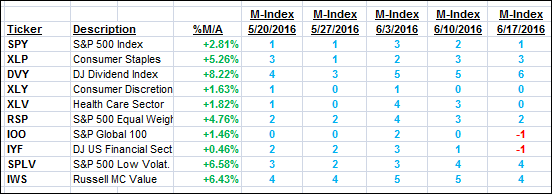
The above table simply demonstrates the magnitude with which some of the ETFs are fluctuating in regards to their positions above or below their respective individual trend lines (%M/A). A break below, represented by a negative number, shows weakness, while a break above, represented by a positive percentage, shows strength.
For hundreds of ETF/Mutual fund choices, be sure to reference Thursday’s StatSheet.
Year to date, here’s how the above candidates have fared so far:
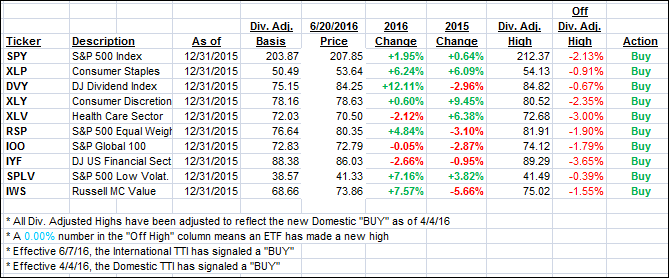
Again, the first table above shows the position of the various ETFs in relation to their respective long term trend lines (%M/A), while the second one tracks their trailing sell stops in the “Off High” column. The “Action” column will signal a “Sell” once the -7.5% point has been taken out in the “Off High” column.
3. Trend Tracking Indexes (TTIs)
Our Domestic Trend Tracking Index (TTI) picked up steam and closed up. The International one really shifted into overdrive and moved back into bullish territory rewarding us for our patience by holding off with the “Sell” signal. I expect more fireworks to come this summer, so the jury is still out as to whether we will remain in Buy mode for any length of time or head for the exits.
Here’s how we ended this tumultuous day:
Domestic TTI: +1.57% (last close +1.36%)—Buy signal effective 4/4/2016
International TTI: +0.60% (last close -1.40%)—Buy signal effective 6/7/2016
Disclosure: I am obliged to inform you that I, as well as advisory clients of mine, own some of these listed ETFs. Furthermore, they do not represent a specific investment recommendation for you, they merely show which ETFs from the universe I track are falling within the guidelines specified.
Contact Ulli