
1. Moving the Markets
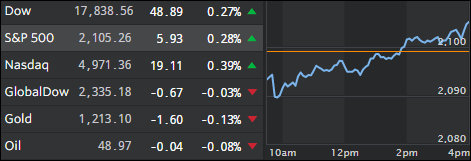
OPEC and oil were the largest market movers today. Imagine my surprise when news came in during mid-day trading that OPEC was not able to seal a deal on capping oil production. The failure to reach a decision underscores the increasingly conflicted interests within the organization. Two members in particular, Saudi Arabia and Iran, are currently in a geopolitical standoff, and analysts say neither country wants to yield market share to the other. The price of U.S. Crude closed at $49 a barrel.
Resurfacing in the news today was more info on Microsoft’s (MSFT) failed acquisition of Nokia (NOK). Microsoft has said that it will lay off up to 1,850 jobs and write down $950 million on its balance sheet. This news largely indicates that the company is going to drop its pursuit of manufacturing smart phones and remain focused on software development.
Wall Street remains focused on the extremely important May jobs report that is slated for release tomorrow. It is important, or course, because the Fed has bluntly stated that the performance of the U.S. economy will dictate a move to raise interest rates in the near future. Analysts are expecting about 160,000 jobs to have been created during May.
We all know that the markets are manipulated and that Fed announcements in regards to possible interest hikes, or lack thereof, determine market direction. Fundamentals no longer matter—until one day they do. So when did this disconnect actually get started?
ZeroHedge had an interesting chart attempting to answer that question. Take a look:
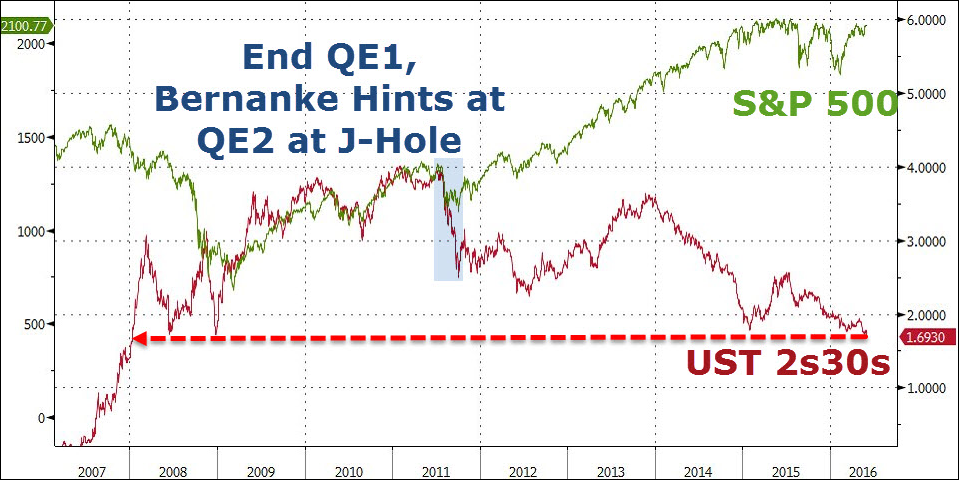
Simply put – Bernanke broke the ‘market’ in the summer of 2011.
2. ETFs in the Spotlight
In case you missed the announcement and description of this section, you can read it here again.
It features 10 broadly diversified ETFs from my HighVolume list as posted every Monday. Furthermore, they are screened for the lowest MaxDD% number meaning they have been showing better resistance to temporary sell offs than all others over the past year.
Here are the 10 candidates:
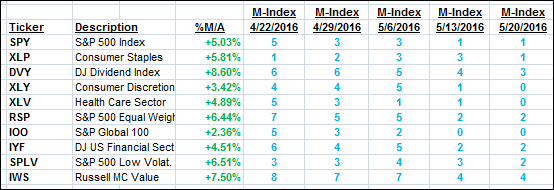
The above table simply demonstrates the magnitude with which some of the ETFs are fluctuating in regards to their positions above or below their respective individual trend lines (%M/A). A break below, represented by a negative number, shows weakness, while a break above, represented by a positive percentage, shows strength.
For hundreds of ETF/Mutual fund choices, be sure to reference Thursday’s StatSheet.
Year to date, here’s how the above candidates have fared so far:
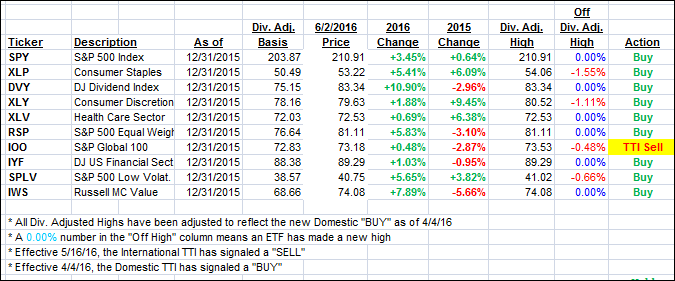
Again, the first table above shows the position of the various ETFs in relation to their respective long term trend lines (%M/A), while the second one tracks their trailing sell stops in the “Off High” column. The “Action” column will signal a “Sell” once the -7.5% point has been taken out in the “Off High” column.
3. Trend Tracking Indexes (TTIs)
Our Domestic Trend Tracking Index (TTI) changed only slightly as Wall Street is in hold mode until tomorrow’s jobs report.
In regards to the International TTI, my theme remains the same in that I want to see more staying power above the line before issuing a new “BUY” so that we can limit the odds of another whip-saw signal.
Here’s how we closed today:
Domestic TTI: +2.14% (last close +1.97%)—Buy signal effective 4/4/2016
International TTI: +1.10% (last close +1.05%)—Sell signal effective 5/16/2016
Disclosure: I am obliged to inform you that I, as well as advisory clients of mine, own some of these listed ETFs. Furthermore, they do not represent a specific investment recommendation for you, they merely show which ETFs from the universe I track are falling within the guidelines specified.
Contact Ulli