
1. Moving the Markets
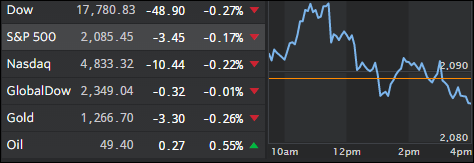
An early rally, fueled by better than expected May home resales, fizzled out in the afternoon as Wall Street focused on the vagaries and uncertainties of tomorrow’s referendum on whether Great Britain will exit the European Union.
A poll published today shows pretty much a statistical tie with “Leave” supporters at 45%, which is just one percent ahead of the “Remain” folks, while 9% are undecided.
Should “Leave” prevail, I expect to see some fireworks in the European markets with a spillover effect to the U.S. Conversely, if “Remain” prevails, equities are bound to engage in a relief rally; the question in my mind is: Will it last or simply be a dead cat bounce?
Janet Yellen continued her congressional testimony for the second day. It pretty much was a repeat of yesterday with the usual jawboning that a recession is not likely but that the British vote and a slowing in U.S. hiring “pose risks to the economic outlook.”
2. ETFs in the Spotlight
In case you missed the announcement and description of this section, you can read it here again.
It features 10 broadly diversified ETFs from my HighVolume list as posted every Monday. Furthermore, they are screened for the lowest MaxDD% number meaning they have been showing better resistance to temporary sell offs than all others over the past year.
Here are the 10 candidates:
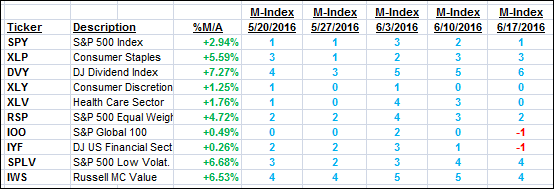
The above table simply demonstrates the magnitude with which some of the ETFs are fluctuating in regards to their positions above or below their respective individual trend lines (%M/A). A break below, represented by a negative number, shows weakness, while a break above, represented by a positive percentage, shows strength.
For hundreds of ETF/Mutual fund choices, be sure to reference Thursday’s StatSheet.
Year to date, here’s how the above candidates have fared so far:
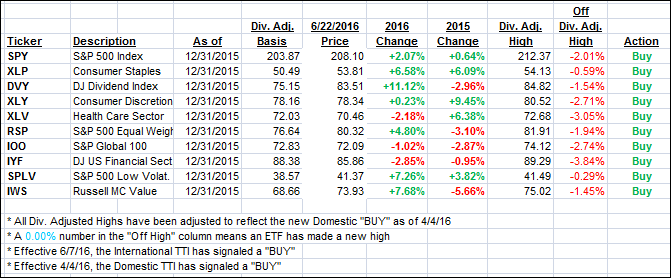
Again, the first table above shows the position of the various ETFs in relation to their respective long term trend lines (%M/A), while the second one tracks their trailing sell stops in the “Off High” column. The “Action” column will signal a “Sell” once the -7.5% point has been taken out in the “Off High” column.
3. Trend Tracking Indexes (TTIs)
Our Domestic Trend Tracking Index (TTI) inched lower by a tad while the International one headed higher by a small margin. For sure, we will see more action over the next couple of days, the direction of which is directly correlated to the outcome of the Brexit.
Here’s how we ended up:
Domestic TTI: +1.54% (last close +1.58%)—Buy signal effective 4/4/2016
International TTI: +0.88% (last close +0.75%)—Buy signal effective 6/7/2016
Disclosure: I am obliged to inform you that I, as well as advisory clients of mine, own some of these listed ETFs. Furthermore, they do not represent a specific investment recommendation for you, they merely show which ETFs from the universe I track are falling within the guidelines specified.
Contact Ulli