
1. Moving the Markets
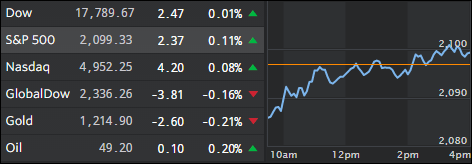
Stocks spent much of the day in the red as Wall Street reacted to sub-par economic data out of China. China’s official purchasing manager’s index for manufacturing was inline with forecasts at 50.1, but that is a dangerous place to be because any number below 50 indicates a contacting economy.
The month of May is best known for the saying, “Sell in May and go away.” That old saying was smudged as stocks gained solidly to round out the month despite the seasonal headwinds that typically accompany May. Of course, this feat was only accomplished with the help of the Fed, who managed interest rate hike speculations well enough to keep the major indexes in the green.
June also usually entails bearish sentiment, mostly due to its poor performance history. Economic data points today were downright dismal with automakers having the second highest inventory in 23 years as GM sales plunged 18%, while sales of Ford and Lincoln passenger cars dropped an amazing 25 percent, which was led by a 37 percent slide for the Taurus sedan.
Let’s keep an eye on commodities and Fed minutes as the month unfolds, as markets remain very reactionary to these two indicators. And, of course, the all important Brexit later on when British voters head to the booths to determine whether Great Britain will stay in the Eurozone or not. If not, expect some fireworks affecting not only Europe stocks but U.S. equities as well. In that scenario, June gloom might be looming.
2. ETFs in the Spotlight
In case you missed the announcement and description of this section, you can read it here again.
It features 10 broadly diversified ETFs from my HighVolume list as posted every Monday. Furthermore, they are screened for the lowest MaxDD% number meaning they have been showing better resistance to temporary sell offs than all others over the past year.
Here are the 10 candidates:
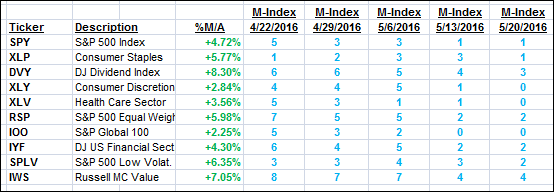
The above table simply demonstrates the magnitude with which some of the ETFs are fluctuating in regards to their positions above or below their respective individual trend lines (%M/A). A break below, represented by a negative number, shows weakness, while a break above, represented by a positive percentage, shows strength.
For hundreds of ETF/Mutual fund choices, be sure to reference Thursday’s StatSheet.
Year to date, here’s how the above candidates have fared so far:
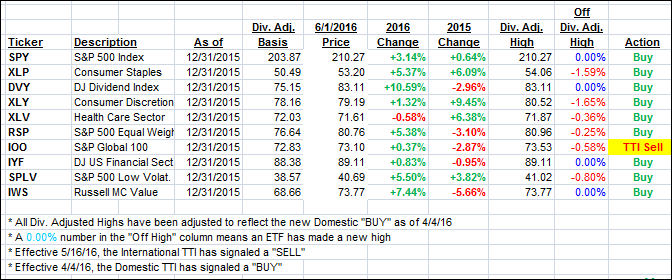
Again, the first table above shows the position of the various ETFs in relation to their respective long term trend lines (%M/A), while the second one tracks their trailing sell stops in the “Off High” column. The “Action” column will signal a “Sell” once the -7.5% point has been taken out in the “Off High” column.
3. Trend Tracking Indexes (TTIs)
Our Domestic Trend Tracking Index (TTI) again barely changed with the major indexes being stuck in a tight range.
In regards to the International TTI, my theme remains the same in that I want to see more staying power above the line before issuing a new “BUY” so that we can limit the odds of another whip-saw signal.
Here’s how we closed today:
Domestic TTI: +1.97% (last close +1.90%)—Buy signal effective 4/4/2016
International TTI: +1.05% (last close +1.13%)—Sell signal effective 5/16/2016
Disclosure: I am obliged to inform you that I, as well as advisory clients of mine, own some of these listed ETFs. Furthermore, they do not represent a specific investment recommendation for you, they merely show which ETFs from the universe I track are falling within the guidelines specified.
Contact Ulli