
1. Moving the Markets
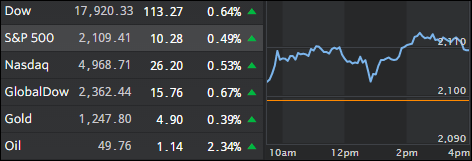
Front-running Fed chief Yellen’s speech was the idea of the day on hopes that Friday’s bad jobs report would be great news for the markets. Forget the Dow today, it was all about the S&P 500 as it set a 2016 closing high in today’s trading, after Fed chair Janet Yellen hinted at a relatively upbeat view of the U.S. economy, despite the horrific May jobs report.
However, in a speech that Wall Street was closely watching, Yellen noted that the Fed may still feel it is appropriate to gradually increase borrowing costs if the labor market regains momentum and inflation perks up. There was no indication as to when the next hike may be though. In other words, no Fed commitment should mean further upward momentum for the markets, no matter how poor the fundamentals, which also means we are about to make new all-time highs in the near future as soon as we get some more negative economic data points, After all, it’s all about maintaining market levels and the chosen tool for this accomplishment is continued dovish/hawkish jawboning by the various Fed mouthpieces.
In commodities news, it seems that oil, gold and silver might be heading towards a bull market in the summer months, which would end a 5-year drought. The speculation is mostly due to the fact that gold is on course to snap three straight annual declines and silver is also higher as concern over the health of the global economy and the dollar’s retreat has boosted demand for precious metals as stores of value.
2. ETFs in the Spotlight
In case you missed the announcement and description of this section, you can read it here again.
It features 10 broadly diversified ETFs from my HighVolume list as posted every Monday. Furthermore, they are screened for the lowest MaxDD% number meaning they have been showing better resistance to temporary sell offs than all others over the past year.
Here are the 10 candidates:
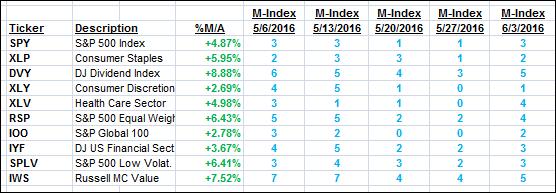
The above table simply demonstrates the magnitude with which some of the ETFs are fluctuating in regards to their positions above or below their respective individual trend lines (%M/A). A break below, represented by a negative number, shows weakness, while a break above, represented by a positive percentage, shows strength.
For hundreds of ETF/Mutual fund choices, be sure to reference Thursday’s StatSheet.
Year to date, here’s how the above candidates have fared so far:
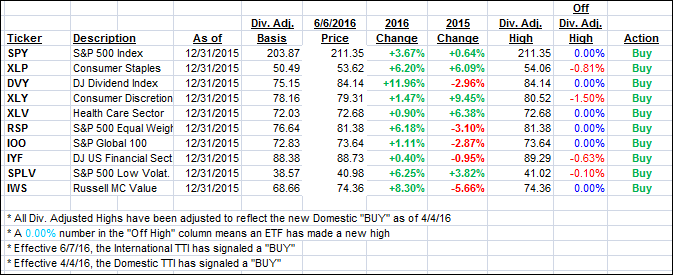
Again, the first table above shows the position of the various ETFs in relation to their respective long term trend lines (%M/A), while the second one tracks their trailing sell stops in the “Off High” column. The “Action” column will signal a “Sell” once the -7.5% point has been taken out in the “Off High” column.
3. Trend Tracking Indexes (TTIs)
Our Domestic Trend Tracking Index (TTI) moved deeper into bullish territory and the International one followed suit generating a new “BUY” signal for that arena effective as of tomorrow, June 7, 2016. To be clear, the International Buy signal covers “broadly diversified international mutual funds/ETFs” only.
Here’s how we ended up:
Domestic TTI: +2.28% (last close +2.09%)—Buy signal effective 4/4/2016
International TTI: +1.73% (last close +1.45%)—Buy signal effective 6/7/2016
Disclosure: I am obliged to inform you that I, as well as advisory clients of mine, own some of these listed ETFs. Furthermore, they do not represent a specific investment recommendation for you, they merely show which ETFs from the universe I track are falling within the guidelines specified.
Contact Ulli