
1. Moving the Markets
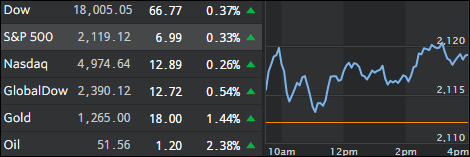
The S&P 500 continued to push towards its all-time high of 2,130.82 today, as the index closed at 2,119.12. Surprising as it may seem, energy has been the main driver for the S&P 500 this year. The Standard & Poor’s 500 index energy sector is up 14.8% to date, which makes it the best of the 10 sectors in the market by far.
Partly driving energy performance higher lately has been oil. The black gold commodity hasn’t settled above $51 since July of 2015, but passed that mark today to close at $51.17 a barrel. This is a notable gain, especially considering that prices were around $30 a barrel for the better part of Q1.
The weaker outlook for global growth continues to be a drag on the market though confirming that the lofty levels of the indexes are simply a function of manipulation. The health of the global economy has just been unable to break out of its low growth trajectory and dangerously low inflation despite massive stimulus and intervention from government authorities worldwide, particularly the ECB and Bank of Japan. It goes to show that the stimulus programs have done nothing but elevate market levels and have had no positive effect on underlying US macro data.
As I posted before, as long as bad economic news abound, translating into continued dovish Fed behavior, the S&P 500 is scheduled to make new all-time highs by next Tuesday at the latest. The question is: Then what?
2. ETFs in the Spotlight
In case you missed the announcement and description of this section, you can read it here again.
It features 10 broadly diversified ETFs from my HighVolume list as posted every Monday. Furthermore, they are screened for the lowest MaxDD% number meaning they have been showing better resistance to temporary sell offs than all others over the past year.
Here are the 10 candidates:
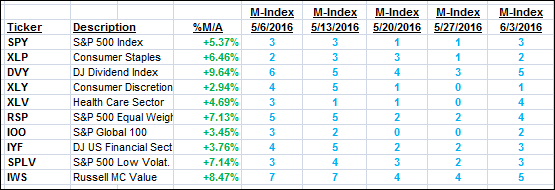
The above table simply demonstrates the magnitude with which some of the ETFs are fluctuating in regards to their positions above or below their respective individual trend lines (%M/A). A break below, represented by a negative number, shows weakness, while a break above, represented by a positive percentage, shows strength.
For hundreds of ETF/Mutual fund choices, be sure to reference Thursday’s StatSheet.
Year to date, here’s how the above candidates have fared so far:
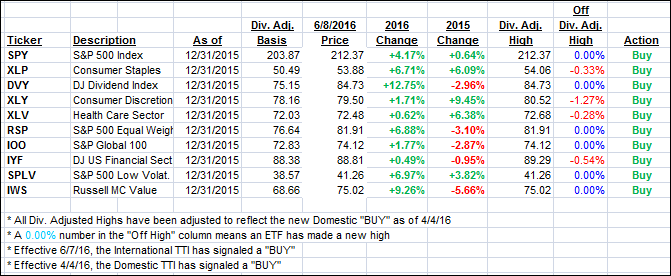
Again, the first table above shows the position of the various ETFs in relation to their respective long term trend lines (%M/A), while the second one tracks their trailing sell stops in the “Off High” column. The “Action” column will signal a “Sell” once the -7.5% point has been taken out in the “Off High” column.
3. Trend Tracking Indexes (TTIs)
Our Domestic Trend Tracking Index (TTI) headed north with the International one joining in. There were no major news reports so it appears that the computer algos are primed to push the S&P 500 to a new all-time high in the near future no matter how ridiculous the underlying economic data points may be.
Here’s how we ended up:
Domestic TTI: +2.55% (last close +2.36%)—Buy signal effective 4/4/2016
International TTI: +2.51% (last close +2.32%)—Buy signal effective 6/7/2016
Disclosure: I am obliged to inform you that I, as well as advisory clients of mine, own some of these listed ETFs. Furthermore, they do not represent a specific investment recommendation for you, they merely show which ETFs from the universe I track are falling within the guidelines specified.
Contact Ulli