
1. Moving the Markets
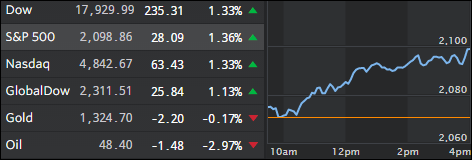
Equities maintained their newly found upward momentum and rallied for the third day in a row by putting the Brexit sell-off in the rear view mirror and making up almost all losses. In the end, the S&P 500 closed out June just about unchanged.
The assists of the day came from the BOE and ECB via hints that more QE may be forthcoming this summer. That’s all it took and the major indexes recorded their best three-day climb since February 17. Of course, quarterly window dressing added to the overall positive tone.
As I have repeatedly posted, the Central Banks own the stock market, and they control its direction via soothing or accommodating statements designed to elevate the indexes to their desired level no matter how horrific the underlying economic data points are.
My view is that sooner or later some reality will set in, no matter what the jawboning, and equities will correct. It may take just one major trigger like, for example, the Italian banking system imploding or, the mother of all derivatives, Deutsche Bank, which stock price is sliding towards single digits, making its best Lehman Brothers imitation, and we will have a crisis on our hands along the lines of 2008. To me, it’s not a matter of “if” but simply “when.” Be prepared by having an exit strategy in place.
2. ETFs in the Spotlight
In case you missed the announcement and description of this section, you can read it here again.
It features 10 broadly diversified ETFs from my HighVolume list as posted every Monday. Furthermore, they are screened for the lowest MaxDD% number meaning they have been showing better resistance to temporary sell offs than all others over the past year.
Here are the 10 candidates:
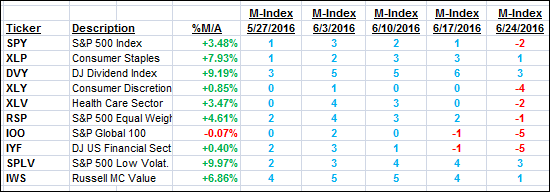
The above table simply demonstrates the magnitude with which some of the ETFs are fluctuating in regards to their positions above or below their respective individual trend lines (%M/A). A break below, represented by a negative number, shows weakness, while a break above, represented by a positive percentage, shows strength.
For hundreds of ETF/Mutual fund choices, be sure to reference Thursday’s StatSheet.
Year to date, here’s how the above candidates have fared so far:
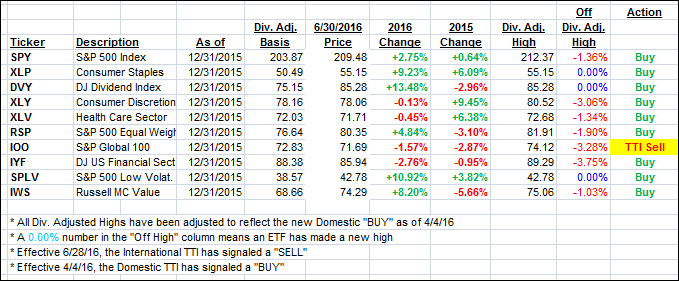
Again, the first table above shows the position of the various ETFs in relation to their respective long term trend lines (%M/A), while the second one tracks their trailing sell stops in the “Off High” column. The “Action” column will signal a “Sell” once the -7.5% point has been taken out in the “Off High” column.
3. Trend Tracking Indexes (TTIs)
Our Domestic Trend Tracking Index (TTI) followed the major indexes and hovers now solidly on the bullish side of its trend line. The International TTI followed suit but remains stuck in bear market territory.
Here’s how we ended up:
Domestic TTI: +1.85% (last close +1.35%)—Buy signal effective 4/4/2016
International TTI: -1.07% (last close -2.07%)—Sell signal effective 6/28/2016
Disclosure: I am obliged to inform you that I, as well as advisory clients of mine, own some of these listed ETFs. Furthermore, they do not represent a specific investment recommendation for you, they merely show which ETFs from the universe I track are falling within the guidelines specified.
Contact Ulli