
1. Moving the Markets
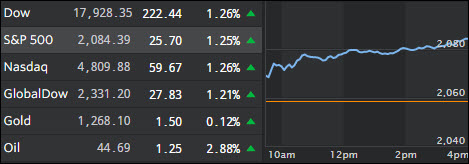
After a volatile session to kick off the week Monday, U.S. stocks surged today as Wall Street attempts to gauge the market’s next move amid a recent stall in momentum after a sizable rally off of the lows in February. If you are looking for a reason to support the rally, there wasn’t any as economic data remains week, earnings haven’t gone anywhere but oil and bonds are in rally mode.
Investors are trying to figure out where to put their money, as the February rush has faded to the fullest. Heading into today’s session, earnings for the S&P 500 are on track to contract 5.5% in Q1, which would mark the third straight quarter of negative growth. Wall Street seems to still be hoping betting on an earnings recovery in the second half of the year though.
Overall, rebounding oil prices in recent months have given the stock market a lift, but in recent days trading in the black gold has become volatile. The price of a barrel of U.S.-produced crude has been a consistent pendulum in and out of positive territory on a daily basis. Today though, U.S. Crude Oil closed up 2.90% at $44.79 a barrel.
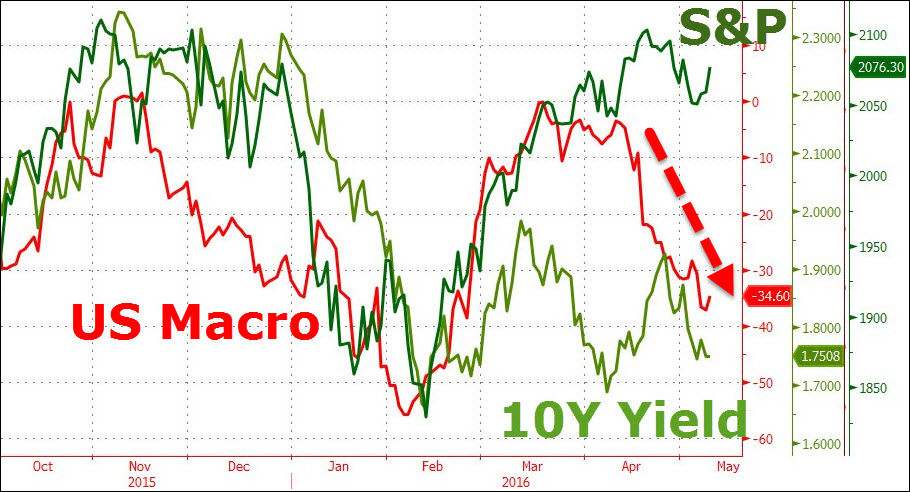
Looking at the following chart, courtesy of ZH, the S&P 500 remains in nosebleed territory and disconnected from US Macro and bond yields. A picture is worth a thousand words:
2. ETFs in the Spotlight
In case you missed the announcement and description of this section, you can read it here again.
It features 10 broadly diversified ETFs from my HighVolume list as posted every Monday. Furthermore, they are screened for the lowest MaxDD% number meaning they have been showing better resistance to temporary sell offs than all others over the past year.
Here are the 10 candidates:
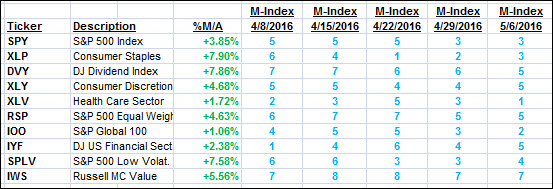
The above table simply demonstrates the magnitude with which some of the ETFs are fluctuating in regards to their positions above or below their respective individual trend lines (%M/A). A break below, represented by a negative number, shows weakness, while a break above, represented by a positive percentage, shows strength.
For hundreds of ETF/Mutual fund choices, be sure to reference Thursday’s StatSheet.
Year to date, here’s how the above candidates have fared so far:
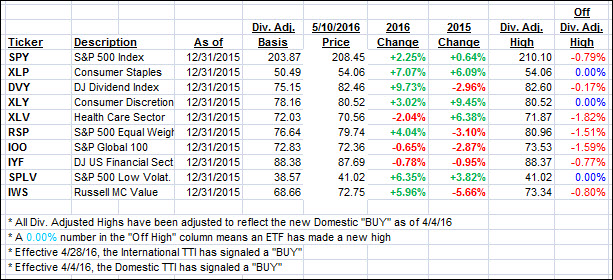
Again, the first table above shows the position of the various ETFs in relation to their respective long term trend lines (%M/A), while the second one tracks their trailing sell stops in the “Off High” column. The “Action” column will signal a “Sell” once the -7.5% point has been taken out in the “Off High” column.
3. Trend Tracking Indexes (TTIs)
Our Domestic Trend Tracking Index (TTI) jumped nicely with the International TTI improving greatly as well.
Here’s how we closed:
Domestic TTI: +1.72% (last close +1.27%)—Buy signal effective 4/4/2016
International TTI: -0.31% (last close -1.28%)—Buy signal effective 4/28/2016
Disclosure: I am obliged to inform you that I, as well as advisory clients of mine, own some of these listed ETFs. Furthermore, they do not represent a specific investment recommendation for you, they merely show which ETFs from the universe I track are falling within the guidelines specified.
Contact Ulli