
1. Moving the Markets
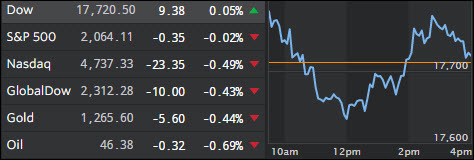
It was a mixed day as the the above intra-day chart of the S&P 500 shows. Dancing above and below its unchanged line and ending 0.02% lower isn’t exactly a sign of a strong bull market.
The Nasdaq fared the worst as Apple got clobbered again tumbling to a two-year low producing a heavy drag on the major indexes. Worries about slowing demand for iPhones were seen as the culprit.
There seems to be a lack of conviction in the market by both, buyers and sellers as the economy grinds along without making any headway. Retailers have been suffering with the latest casualty being Nordstrom with their disaster earnings announcement after hours. As I am writing this, the stock is getting clobbered at the tune of -17%. Ouch…
2. ETFs in the Spotlight
In case you missed the announcement and description of this section, you can read it here again.
It features 10 broadly diversified ETFs from my HighVolume list as posted every Monday. Furthermore, they are screened for the lowest MaxDD% number meaning they have been showing better resistance to temporary sell offs than all others over the past year.
Here are the 10 candidates:
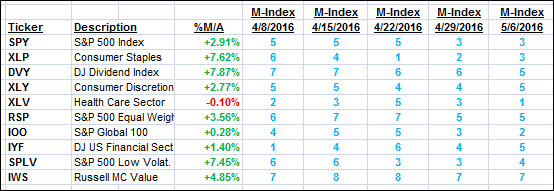
The above table simply demonstrates the magnitude with which some of the ETFs are fluctuating in regards to their positions above or below their respective individual trend lines (%M/A). A break below, represented by a negative number, shows weakness, while a break above, represented by a positive percentage, shows strength.
For hundreds of ETF/Mutual fund choices, be sure to reference Thursday’s StatSheet.
Year to date, here’s how the above candidates have fared so far:
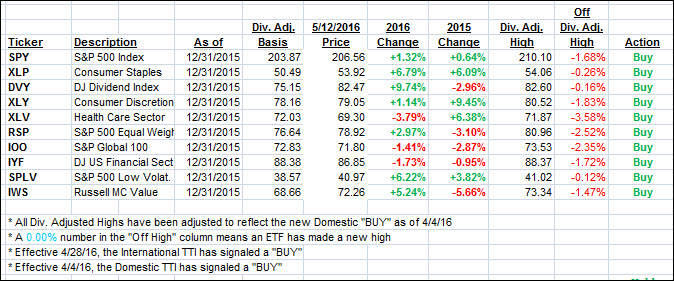
Again, the first table above shows the position of the various ETFs in relation to their respective long term trend lines (%M/A), while the second one tracks their trailing sell stops in the “Off High” column. The “Action” column will signal a “Sell” once the -7.5% point has been taken out in the “Off High” column.
3. Trend Tracking Indexes (TTIs)
Our Domestic Trend Tracking Index (TTI) barely changed while the International one took a dive as the market see-sawed, which it has done since the very moment we got our Buy signal on 4/28/16. I’ll give it a little more time to see if it turns around. If not, I will consider this a whip-saw signal and issue a “Sell.” Again, we are not having any holdings in that arena and therefore no money at risk.
Here’s how we ended up:
Domestic TTI: +1.26% (last close +1.32%)—Buy signal effective 4/4/2016
International TTI: -1.24% (last close -0.87%)—Buy signal effective 4/28/2016
Disclosure: I am obliged to inform you that I, as well as advisory clients of mine, own some of these listed ETFs. Furthermore, they do not represent a specific investment recommendation for you, they merely show which ETFs from the universe I track are falling within the guidelines specified.
Contact Ulli