
1. Moving the Markets
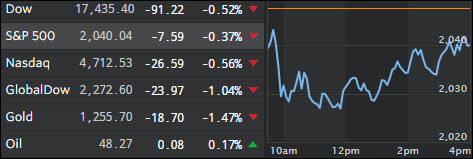
Stocks fell despite a big earnings beat from retailer Wal-Mart (WMT)
Walmart (WMT) bucked the trend of many U.S. retailers this profit-reporting season, reporting that its earnings, revenues and sales all handily topped Wall Street’s estimates. Shares of the retailer gained almost 10% on the day. The positive news from the company suppressed fears that U.S. consumers are cutting back spending.
A better-than-expected quarterly profit report from Walmart offset some of the market’s lingering weakness sparked by the Federal Reserve on Wednesday, which noted to investors an interest rate hike might occur in June if U.S. economic data continues to strengthen.
U.S. crude was negatively impacted by the Fed statement that they are seriously considering their second rate hike since 2006 at its meeting next month. U.S. oil closed down at $48.60 a barrel.
The value of the USD continued to rise today, which is not in the best interest for exports. The rising valuation could negatively impact global sales of U.S. goods as they become more and more expensive. The currency is now once again at its highest level since March.
2. ETFs in the Spotlight
In case you missed the announcement and description of this section, you can read it here again.
It features 10 broadly diversified ETFs from my HighVolume list as posted every Monday. Furthermore, they are screened for the lowest MaxDD% number meaning they have been showing better resistance to temporary sell offs than all others over the past year.
Here are the 10 candidates:
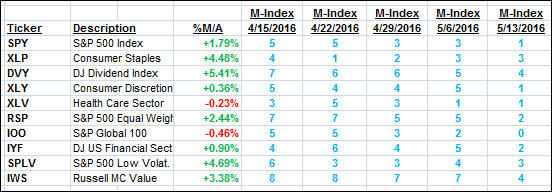
The above table simply demonstrates the magnitude with which some of the ETFs are fluctuating in regards to their positions above or below their respective individual trend lines (%M/A). A break below, represented by a negative number, shows weakness, while a break above, represented by a positive percentage, shows strength.
For hundreds of ETF/Mutual fund choices, be sure to reference Thursday’s StatSheet.
Year to date, here’s how the above candidates have fared so far:
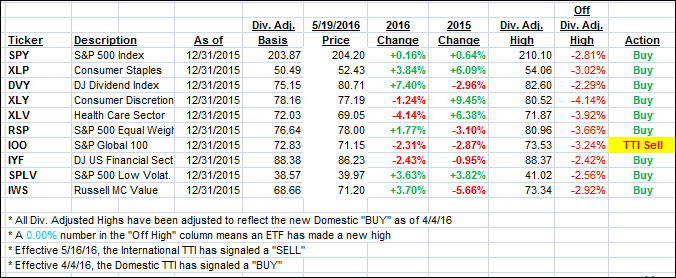
Again, the first table above shows the position of the various ETFs in relation to their respective long term trend lines (%M/A), while the second one tracks their trailing sell stops in the “Off High” column. The “Action” column will signal a “Sell” once the -7.5% point has been taken out in the “Off High” column.
3. Trend Tracking Indexes (TTIs)
Our Domestic Trend Tracking Index (TTI) headed south with the International TTI taking the lead by heading deeper into bear market territory. After its recent whip-saw, it may very well turn out to be the canary in the coal mine.
Here’s how we ended up:
Domestic TTI: +0.60% (last close +0.75%)—Buy signal effective 4/4/2016
International TTI: -1.63% (last close -1.16%)—Sell signal effective 5/16/2016
Disclosure: I am obliged to inform you that I, as well as advisory clients of mine, own some of these listed ETFs. Furthermore, they do not represent a specific investment recommendation for you, they merely show which ETFs from the universe I track are falling within the guidelines specified.
Contact Ulli