
1. Moving the Markets
Today marks the first trading day of May, and ushers in what has historically been the worst six-month stretch for stocks. And while there’s no denying that history shows the May-through-September period delivers far lower stock returns than the more bullish October-through-April time frame, implementing this rather extreme market-timing approach to investing might be a bit of overkill. After all, we prefer letting our Trend Tracking Indexes (TTIs) and trailing sell stops be our guide to market exposure.
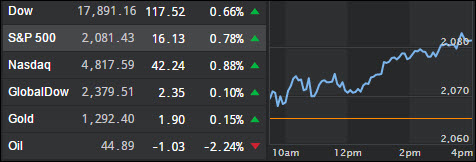
The S&P 500 remains above 2,000 and the DOW keeps flirting with 18,000. U.S. Crude also has maintained a steady climb to $45.00 a barrel but got pulled off its lofty levels today.
To kick off the month in economic news, a gauge of U.S. factory activity fell in April as U.S. macro data continue to slump and China data weakens.
In earnings news, Cisco (CSCO) reported better-than-expected Q3 results as volume rose and the firm’s cost-cutting measures took hold.
With earnings season pretty much over, investors are keeping their eyes on the upcoming summer months to see how currency issues and oil prices (which are on the rise) will impact markets.
2. ETFs in the Spotlight
In case you missed the announcement and description of this section, you can read it here again.
It features 10 broadly diversified ETFs from my HighVolume list as posted every Monday. Furthermore, they are screened for the lowest MaxDD% number meaning they have been showing better resistance to temporary sell offs than all others over the past year.
Here are the 10 candidates:
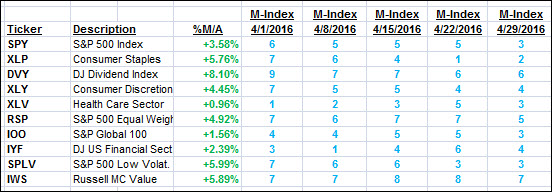
The above table simply demonstrates the magnitude with which some of the ETFs are fluctuating in regards to their positions above or below their respective individual trend lines (%M/A). A break below, represented by a negative number, shows weakness, while a break above, represented by a positive percentage, shows strength.
For hundreds of ETF/Mutual fund choices, be sure to reference Thursday’s StatSheet.
Year to date, here’s how the above candidates have fared so far:
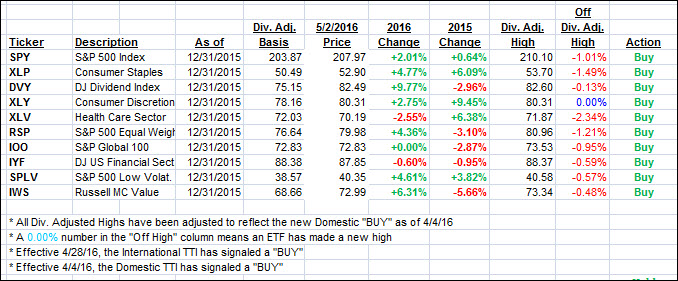
Again, the first table above shows the position of the various ETFs in relation to their respective long term trend lines (%M/A), while the second one tracks their trailing sell stops in the “Off High” column. The “Action” column will signal a “Sell” once the -7.5% point has been taken out in the “Off High” column.
3. Trend Tracking Indexes (TTIs)
Our Domestic Trend Tracking Index (TTI) recovered along with its international cousin as the major indexes started the month of May on a positive.
Here’s how we ended up:
Domestic TTI: +1.80% (last close +1.29%)—Buy signal effective 4/4/2016
International TTI: +0.81% (last close +0.46%)—Buy signal effective 4/28/2016
Disclosure: I am obliged to inform you that I, as well as advisory clients of mine, own some of these listed ETFs. Furthermore, they do not represent a specific investment recommendation for you, they merely show which ETFs from the universe I track are falling within the guidelines specified.
Contact Ulli