
1. Moving the Markets
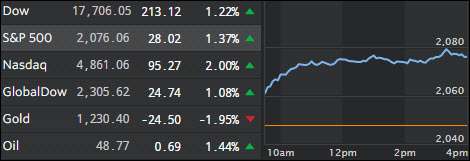
After an uneventful start to the week, markets here in the U.S. sprang back into action and posted their largest gains since early May. All three major indexes gained at least 1.20% on the day but with volume being downright atrocious, this move is suspect.
The year has been volatile thus far to say the least. A big reason for this volatility has been the Federal Reserve’s on-again, off-again plan to normalize interest rates. However, markets always tend to react well to solid economic data, and it was good news on the housing front that pushed markets higher today.
The Commerce Department reported that sales of new single-family homes jumped almost 17% to an annualized pace of 619,000 in April. That is the highest level since January 2008 and well above the 523,000 new home sales that economists were expecting in April. Of course, extreme numbers like this are likely to be revised sharply, which we will find out next month.
Also providing a lift for stocks Tuesday was a reversal to the upside for U.S. crude, which traded lower in the day, but mounted a strong comeback by the closing bell. A barrel of U.S. crude gained 1.48% on the day to close at $48.78.
And in M&A news, I mentioned yesterday that Monsanto (MON) was being courted for an acquisition by Bayer AG (BAYRY). Well, news stories today were quite clear in stating that Monsanto has officially turned down the $62 billion offer as being “financially inadequate”. A spokesperson from the company did say that they would entertain future offers from Bayer AG though.
2. ETFs in the Spotlight
In case you missed the announcement and description of this section, you can read it here again.
It features 10 broadly diversified ETFs from my HighVolume list as posted every Monday. Furthermore, they are screened for the lowest MaxDD% number meaning they have been showing better resistance to temporary sell offs than all others over the past year.
Here are the 10 candidates:
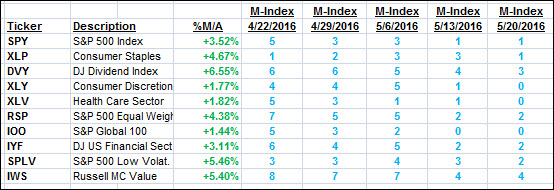
The above table simply demonstrates the magnitude with which some of the ETFs are fluctuating in regards to their positions above or below their respective individual trend lines (%M/A). A break below, represented by a negative number, shows weakness, while a break above, represented by a positive percentage, shows strength.
For hundreds of ETF/Mutual fund choices, be sure to reference Thursday’s StatSheet.
Year to date, here’s how the above candidates have fared so far:
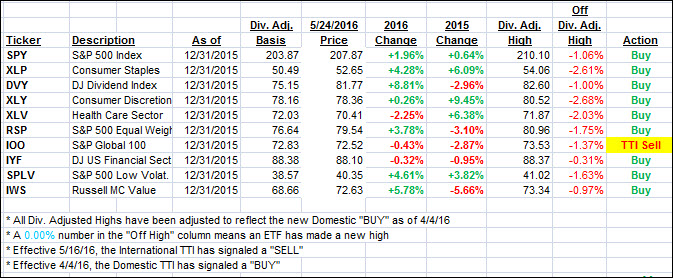
Again, the first table above shows the position of the various ETFs in relation to their respective long term trend lines (%M/A), while the second one tracks their trailing sell stops in the “Off High” column. The “Action” column will signal a “Sell” once the -7.5% point has been taken out in the “Off High” column.
3. Trend Tracking Indexes (TTIs)
Our Domestic Trend Tracking Index (TTI) shifted into high gear as the major indexes closed in the green. The only fly in the ointment was very low volume, which makes this rebound suspect. Nevertheless, the International TTI recovered as well and managed to close back above its long term trend line by a fraction. We’ll have to wait and see if this was just a dead cat bounce or the beginning of something more substantial.
Here’s how we closed:
Domestic TTI: +1.43% (last close +0.80%)—Buy signal effective 4/4/2016
International TTI: +0.01% (last close -0.98%)—Sell signal effective 5/16/2016
Disclosure: I am obliged to inform you that I, as well as advisory clients of mine, own some of these listed ETFs. Furthermore, they do not represent a specific investment recommendation for you, they merely show which ETFs from the universe I track are falling within the guidelines specified.
Contact Ulli