
1. Moving the Markets
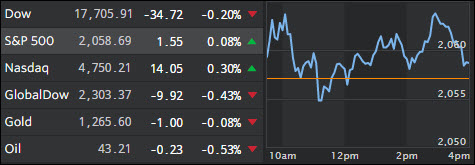
The U.S. stock market, currently riding a two-week losing streak amid signs of fading momentum after a big rally off the market lows back in February, kicked off the new week with mixed results and little signs of breaking out to the upside.
Oil dropped a bit, there was some news on the M&A side and tech stocks remain strong.
While there’s no economic data releases of importance set for release this week, Wall Street will watch the tail-end of the Q1 earnings season, which has been weak, but not as bad as feared, which was simply a function of sharply reduced expectations. With 438 of the 500 S&P companies having already reported, earnings are seen contracting “only” 5.1%, which is far better than the 8% slide forecast at the start of the reporting season.
In M&A news today, we head that Krispy Kreme Doughnuts (KKD), the chain famous for its simple glazed pleasure will be acquired by JAB Beech, a subsidiary of investment firm JAB Holdings Company. The deal is valued at $1.35 billion and JAB Beech will pay $21 a share in cash for Krispy Kreme, which is a 25% premium over the company’s Friday closing stock price of $16.86. The deal will turn Krispy Kreme into a private company and is expected to close in Q3 of this year.
2. ETFs in the Spotlight
In case you missed the announcement and description of this section, you can read it here again.
It features 10 broadly diversified ETFs from my HighVolume list as posted every Monday. Furthermore, they are screened for the lowest MaxDD% number meaning they have been showing better resistance to temporary sell offs than all others over the past year.
Here are the 10 candidates:
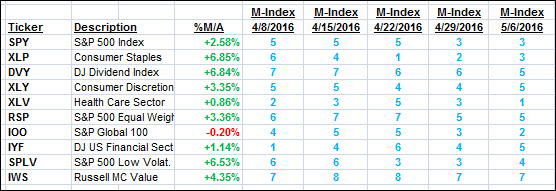
The above table simply demonstrates the magnitude with which some of the ETFs are fluctuating in regards to their positions above or below their respective individual trend lines (%M/A). A break below, represented by a negative number, shows weakness, while a break above, represented by a positive percentage, shows strength.
For hundreds of ETF/Mutual fund choices, be sure to reference Thursday’s StatSheet.
Year to date, here’s how the above candidates have fared so far:
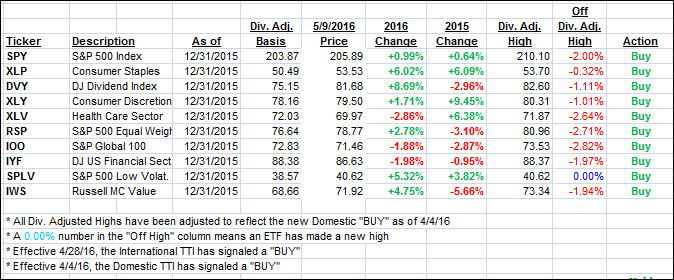
Again, the first table above shows the position of the various ETFs in relation to their respective long term trend lines (%M/A), while the second one tracks their trailing sell stops in the “Off High” column. The “Action” column will signal a “Sell” once the -7.5% point has been taken out in the “Off High” column.
3. Trend Tracking Indexes (TTIs)
Our Domestic Trend Tracking Index (TTI) improved slightly while the International one slipped again showing much more volatitliy than we are used to seeing. We’re close to a “Sell” signal in that arena, and I will advise you once it becomes effective, which could very well be within the next couple of days.
Here’s how we ended up:
Domestic TTI: +1.27% (last Friday +1.11%)—Buy signal effective 4/4/2016
International TTI: -1.28% (last Friday -1.08%)—Buy signal effective 4/28/2016
Disclosure: I am obliged to inform you that I, as well as advisory clients of mine, own some of these listed ETFs. Furthermore, they do not represent a specific investment recommendation for you, they merely show which ETFs from the universe I track are falling within the guidelines specified.
Contact Ulli