
1. Moving the Markets
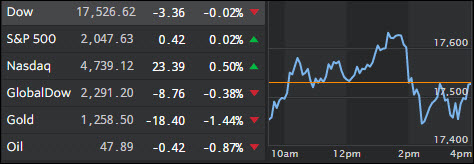
Volatility was minimal as we closed out the mid-week trading day.
We heard earnings reports from Target (TGT) today, which disappointed investors to say the least. The company missed analyst’s estimates on Q1 sales while delivering a disappointing forecast for the Q2. Corporate said it expects sales in the second quarter to be from flat to down as much as 2% as shoppers pull back their spending. Baby, kids, style and wellness continue to be the largest revenue streams for Target.
In tech, Apple’s (AAPL) stock gained about 1% today, but is still trying to fight its way back from a tremendous drop from its April high of $109 a share. Investors have seen $240 billion in wealth evaporate in their Apple holdings since that time. Some hope the big losses in Apple’s market value will attract back investors who see it as a value.
I am keeping my eyes on economic data and how it will impact the Fed’s decision regarding interest rates. The minutes suggest that economic data over the next few weeks, particularly the May jobs survey, will be critical in determining whether the Fed hikes rates again in June.
In a statement after the April meeting, the Fed gave no clear signal about whether a rate hike at its mid-June meeting is likely yet today the words were “most Fed officials saw a June hike ‘likely’ if economy warranted,” leaving everyone confused as to what will happen next.
2. ETFs in the Spotlight
In case you missed the announcement and description of this section, you can read it here again.
It features 10 broadly diversified ETFs from my HighVolume list as posted every Monday. Furthermore, they are screened for the lowest MaxDD% number meaning they have been showing better resistance to temporary sell offs than all others over the past year.
Here are the 10 candidates:
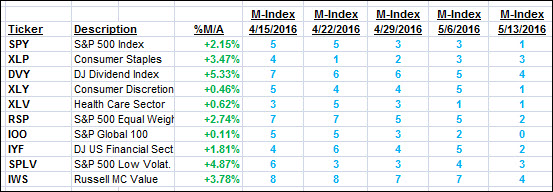
The above table simply demonstrates the magnitude with which some of the ETFs are fluctuating in regards to their positions above or below their respective individual trend lines (%M/A). A break below, represented by a negative number, shows weakness, while a break above, represented by a positive percentage, shows strength.
For hundreds of ETF/Mutual fund choices, be sure to reference Thursday’s StatSheet.
Year to date, here’s how the above candidates have fared so far:
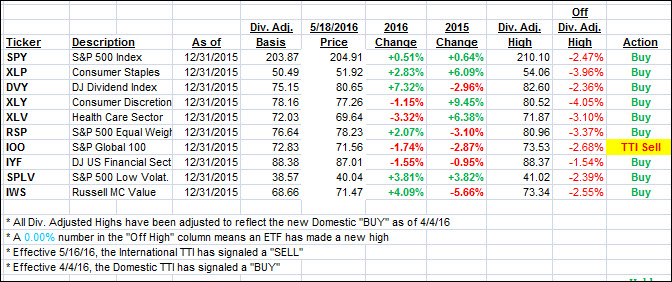
Again, the first table above shows the position of the various ETFs in relation to their respective long term trend lines (%M/A), while the second one tracks their trailing sell stops in the “Off High” column. The “Action” column will signal a “Sell” once the -7.5% point has been taken out in the “Off High” column.
3. Trend Tracking Indexes (TTIs)
Our Domestic Trend Tracking Index (TTI) dropped slightly as the markets ended unchanged with the FOMC meeting throwing more uncertainty in the mix as to a June rate hike.
Here’s how we closed:
Domestic TTI: +0.75% (last close +0.85%)—Buy signal effective 4/4/2016
International TTI: -1.16% (last close -1.26%)—Sell signal effective 5/16/2016
Disclosure: I am obliged to inform you that I, as well as advisory clients of mine, own some of these listed ETFs. Furthermore, they do not represent a specific investment recommendation for you, they merely show which ETFs from the universe I track are falling within the guidelines specified.
Contact Ulli