
1. Moving the Markets
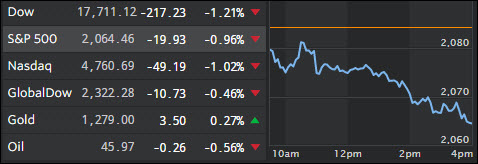
After posting its biggest daily gain since March 1, the Dow’s upward move did not last too long and the warm fuzzy feeling from yesterday dissipated in a hurry.
Hitting the markets today, was the news that Staples (SPLS) decided to bail on its $6.3 billion acquisition of Office Depot (ODP) after a federal judge blocked a merger bid. Apparently, the judge sided with regulators that a joining of the two companies could impair competition in the near future. Shares of Staples fell more than 17%.
Another big downer for the Dow was that Q1 earnings from Disney (DIS) missed for the first time in five years. Subsequently, the news pushed Disney shares down 4.0% to $102.29. Disney’s big loss was responsible for the bulk of the Dow’s decline today.
U.S. Crude Oil maintained its recent rise to close at $46.07 per barrel. The commodity keeps pushing towards the $50 mark and oil bulls are hoping that the economy will hit that mark by summer time. Given massive production increases worldwide, slowing demand and overflowing storage facilities, I would not hold my breath for that one.
2. ETFs in the Spotlight
In case you missed the announcement and description of this section, you can read it here again.
It features 10 broadly diversified ETFs from my HighVolume list as posted every Monday. Furthermore, they are screened for the lowest MaxDD% number meaning they have been showing better resistance to temporary sell offs than all others over the past year.
Here are the 10 candidates:
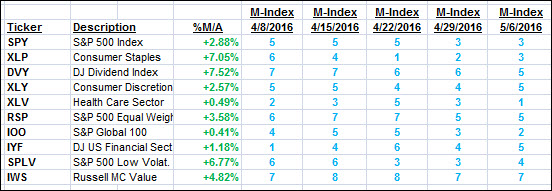
The above table simply demonstrates the magnitude with which some of the ETFs are fluctuating in regards to their positions above or below their respective individual trend lines (%M/A). A break below, represented by a negative number, shows weakness, while a break above, represented by a positive percentage, shows strength.
For hundreds of ETF/Mutual fund choices, be sure to reference Thursday’s StatSheet.
Year to date, here’s how the above candidates have fared so far:
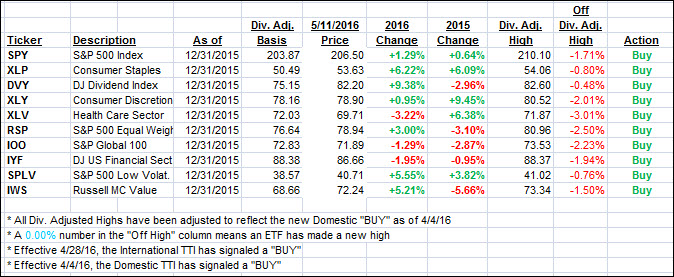
Again, the first table above shows the position of the various ETFs in relation to their respective long term trend lines (%M/A), while the second one tracks their trailing sell stops in the “Off High” column. The “Action” column will signal a “Sell” once the -7.5% point has been taken out in the “Off High” column.
3. Trend Tracking Indexes (TTIs)
Our Domestic Trend Tracking Index (TTI) pulled back again as the major indexes pretty much surrendered all of yesterday’s gains. Again, I will wait for more downside confirmation before pulling the plug on the International Buy signal.
Here’s how we closed:
Domestic TTI: +1.32% (last close +1.72%)—Buy signal effective 4/4/2016
International TTI: -0.87% (last close -0.31%)—Buy signal effective 4/28/2016
Disclosure: I am obliged to inform you that I, as well as advisory clients of mine, own some of these listed ETFs. Furthermore, they do not represent a specific investment recommendation for you, they merely show which ETFs from the universe I track are falling within the guidelines specified.
Contact Ulli