
1. Moving the Markets
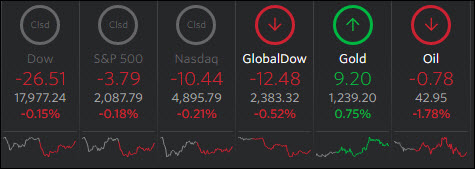
U.S. stocks retreated today as investors brace for a barrage of earnings reports, a slew of fresh economic data and the Federal Reserve’s decision Wednesday on interest rates.
The earnings season, according to MSM, has fared well thus far, if you can call beating a bar that has been set extremely low a news-worthy event. Nevertheless, 77% of the 132 companies that have reported earnings have topped these basement expectations. There is no major signal in this earnings season though and investors are still waiting for a confirmation that earnings will increase in the future. Well, I won’t hold my breath for that announcement.
The Fed breaks from its two-day policy meeting Wednesday at 2 p.m. ET and investors around the globe will be watching to see what the U.S. central bank says about the timing of its next interest rate hike. My guess: It won’t happen….
Costco was back in the headlines today, after buzz that annual memberships may increase from $5-10 per member in 2017. The trend has been for the company to raise membership fees every 5-6 years and the last time that fees were raised was back in 2011. Fees for a Basic Membership are $55 and $110 for Executive Memberships.
In oil news, the prince of Saudi Arabia has laid out a sweeping plan to transform the kingdom from its heavy reliance on oil to a more diverse economy. Among other proposals to boost non-oil revenue, the leader said today that they should invest more in mineral mining and expand the kingdom’s military production. The future impact on oil prices is still TBD.
2. ETFs in the Spotlight
In case you missed the announcement and description of this section, you can read it here again.
It features 10 broadly diversified ETFs from my HighVolume list as posted every Monday. Furthermore, they are screened for the lowest MaxDD% number meaning they have been showing better resistance to temporary sell offs than all others over the past year.
Here are the 10 candidates:
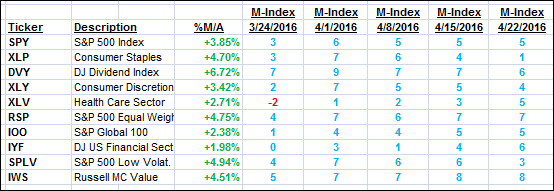
The above table simply demonstrates the magnitude with which some of the ETFs are fluctuating in regards to their positions above or below their respective individual trend lines (%M/A). A break below, represented by a negative number, shows weakness, while a break above, represented by a positive percentage, shows strength.
For hundreds of ETF/Mutual fund choices, be sure to reference Thursday’s StatSheet.
Year to date, here’s how the above candidates have fared so far:
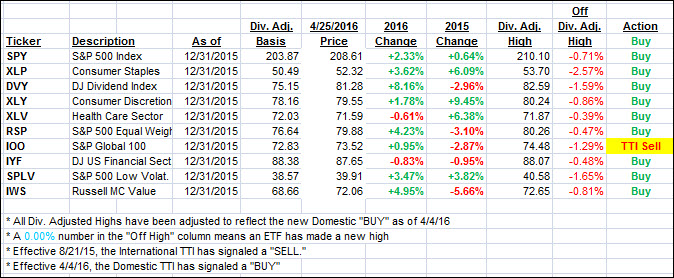
Again, the first table above shows the position of the various ETFs in relation to their respective long term trend lines (%M/A), while the second one tracks their trailing sell stops in the “Off High” column. The “Action” column will signal a “Sell” once the -7.5% point has been taken out in the “Off High” column.
3. Trend Tracking Indexes (TTIs)
Our Domestic Trend Tracking Index (TTI) slipped today and its International cousin followed suit. There are no changes to our investment positions.
Here’s how we closed:
Domestic TTI: +1.61% (last close +1.74%)—Buy signal effective 4/4/2016
International TTI: +0.66% (last close +0.88%)—Sell signal effective 8/21/2015
Disclosure: I am obliged to inform you that I, as well as advisory clients of mine, own some of these listed ETFs. Furthermore, they do not represent a specific investment recommendation for you, they merely show which ETFs from the universe I track are falling within the guidelines specified.
Contact Ulli