
1. Moving the Markets
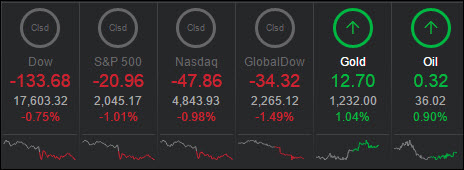
The U.S. stock market posted its second day of losses, not due to any major market moving news, but because of anticipation of…earnings season.
Earnings season kicks off a week from today (April 11th) and investor sentiment is mixed in its expectations. Many investors are speculating that Q1 growth will be minimal, but others remain bullish that growth will pick up towards the end of Q2 and ride the wave of solid growth into Q3. As always, we will simply follow the long-term trend, which is currently bullish, but we have no issue with exiting should this bullish signal turn out to be a headfake.
Oil remains as low as it was a year ago and we are still experiencing some currency pressure on the USD as it is presently on a 5-day slide. Both have a formidable impact on the market, so keep an eye on those two indicators and how they correlate to earnings season.
Tesla had a bit of a scare today, but the stock moved higher nonetheless. Tesla (TSLA) had a hiccup in new vehicle deliveries due to a shortage of parts. Elon Musk said that it has addressed the delivery shortcomings and assures they will not be repeated when the model 3 sedan hits the market next year. The company says it is on track to deliver 80,000 to 90,000 new vehicles this year.
2. ETFs in the Spotlight
In case you missed the announcement and description of this section, you can read it here again.
It features 10 broadly diversified ETFs from my HighVolume list as posted every Monday. Furthermore, they are screened for the lowest MaxDD% number meaning they have been showing better resistance to temporary sell offs than all others over the past year.
Here are the 10 candidates:
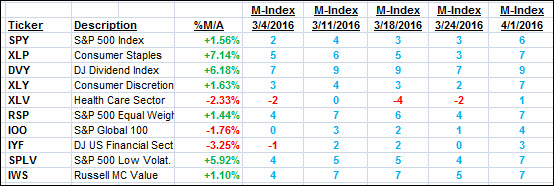
The above table simply demonstrates the magnitude with which some of the ETFs are fluctuating in regards to their positions above or below their respective individual trend lines (%M/A). A break below, represented by a negative number, shows weakness, while a break above, represented by a positive percentage, shows strength.
For hundreds of ETF/Mutual fund choices, be sure to reference Thursday’s StatSheet.
Year to date, here’s how the above candidates have fared so far:
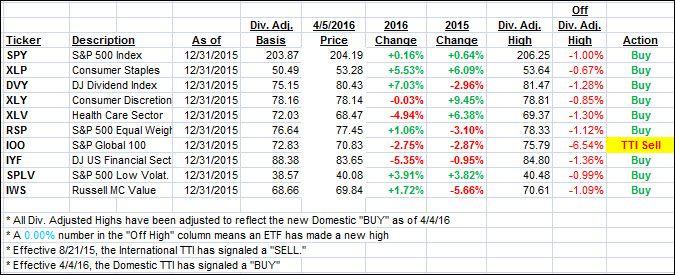
Again, the first table above shows the position of the various ETFs in relation to their respective long term trend lines (%M/A), while the second one tracks their trailing sell stops in the “Off High” column. The “Action” column will signal a “Sell” once the -7.5% point has been taken out in the “Off High” column.
3. Trend Tracking Indexes (TTIs)
Our Domestic Trend Tracking Index (TTI) pulled back but remains on the bullish side of the trend line for the time being.
Here’s how we ended up:
Domestic TTI: +1.02% (last close +1.33%)—Buy signal effective 4/4/2016
International TTI: -3.69% (last close -2.39%)—Sell signal effective 8/21/2015
Disclosure: I am obliged to inform you that I, as well as advisory clients of mine, own some of these listed ETFs. Furthermore, they do not represent a specific investment recommendation for you, they merely show which ETFs from the universe I track are falling within the guidelines specified.
Contact Ulli