
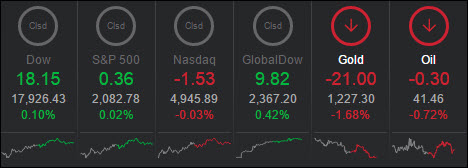
Stocks ended flat Thursday, taking a breather after a nice two day rally.
Trading today was mostly influenced by earnings reports from Bank of America (BAC) and Wells Fargo (WFC). Bank of America topped both earnings and revenue estimates. Wells Fargo topped profit expectations but was slightly below par on revenue. BofA gained and Wells fell slightly.
The results from these two banking giants were a bit of a disappointment after JPMorgan (JPM) posted such strong gains yesterday. But, there has to be a winner sometimes.
We also digested another strong reading on the jobs market here in the U.S. The latest number on weekly jobless claims fell from 266,000 to 253,000 the week before. In addition, the consumer price index (CPI) rose in March. Crude oil stayed above $41 a barrel today, which may give some confidence to the bulls.
2. ETFs in the Spotlight
In case you missed the announcement and description of this section, you can read it here again.
It features 10 broadly diversified ETFs from my HighVolume list as posted every Monday. Furthermore, they are screened for the lowest MaxDD% number meaning they have been showing better resistance to temporary sell offs than all others over the past year.
Here are the 10 candidates:
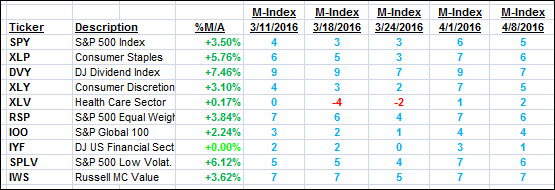
The above table simply demonstrates the magnitude with which some of the ETFs are fluctuating in regards to their positions above or below their respective individual trend lines (%M/A). A break below, represented by a negative number, shows weakness, while a break above, represented by a positive percentage, shows strength.
For hundreds of ETF/Mutual fund choices, be sure to reference Thursday’s StatSheet.
Year to date, here’s how the above candidates have fared so far:
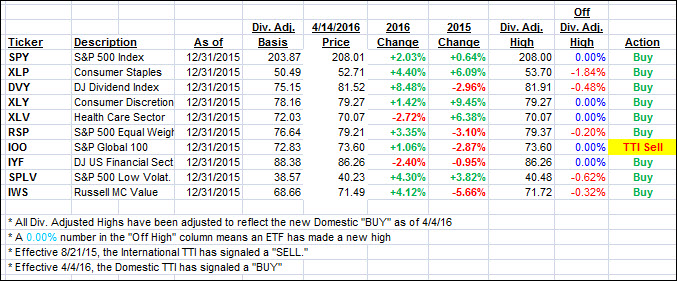
Again, the first table above shows the position of the various ETFs in relation to their respective long term trend lines (%M/A), while the second one tracks their trailing sell stops in the “Off High” column. The “Action” column will signal a “Sell” once the -7.5% point has been taken out in the “Off High” column.
3. Trend Tracking Indexes (TTIs)
Our Domestic Trend Tracking Index (TTI) changed only immaterially while the International one moved closer to a new Buy signal.
Here’s how we closed:
Domestic TTI: +1.74% (last close +1.80%)—Buy signal effective 4/4/2016
International TTI: -0.43% (last close -0.61%)—Sell signal effective 8/21/2015
Disclosure: I am obliged to inform you that I, as well as advisory clients of mine, own some of these listed ETFs. Furthermore, they do not represent a specific investment recommendation for you, they merely show which ETFs from the universe I track are falling within the guidelines specified.
Contact Ulli