
1. Moving the Markets
Wall Street kicked off the week to a mediocre start after posting solid gains the week prior. Better than expected readings on jobs, manufacturing and interest rates were market movers last week. This week, Wall Street will be focusing more on economic data, such as February factory orders and the March reading on the services sector.
I am still pondering whether the rally since mid-February has real staying power or whether it’s a fleeting bounce that will end with the market reverting back to its early-year downward trend and lead to the first bear market, or 20% drop, since the 2008-2009 financial crisis. While no one has an answer, market action this morning confirmed our “Buy” signal from Friday to start moving back into “broadly diversified domestic equity ETFs/Mutual funds,” a process which I started in my advisor practice this morning.
Again, we will carefully participate in this new cycle with limited exposure to make sure the trend holds before making further commitments.
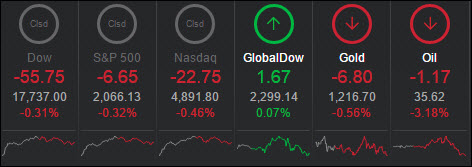
Crude oil got spanked again as prices dropped 3.78% to close at $35.62 a barrel. Some analysts are now predicting that in the face of the oil glut with storage spaces overflowing, reduced demand and the scheduling of useless OPEC meetings may push oil back into the 20s.
No good news for SunEdison (SUNE) today. The company is bleeding cash and continues to stumble towards an anticipated bankruptcy filing in the near future. Its descent hit top speed in early March when their proposed acquisition of solar company Vivint collapsed after it was not able to secure the financing necessary to seal the deal. The stock now stands at $0.21 a share.
2. ETFs in the Spotlight
In case you missed the announcement and description of this section, you can read it here again.
It features 10 broadly diversified ETFs from my HighVolume list as posted every Monday. Furthermore, they are screened for the lowest MaxDD% number meaning they have been showing better resistance to temporary sell offs than all others over the past year.
Here are the 10 candidates:
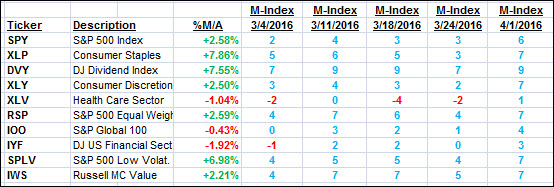
The above table simply demonstrates the magnitude with which some of the ETFs are fluctuating in regards to their positions above or below their respective individual trend lines (%M/A). A break below, represented by a negative number, shows weakness, while a break above, represented by a positive percentage, shows strength.
For hundreds of ETF/Mutual fund choices, be sure to reference Thursday’s StatSheet.
Year to date, here’s how the above candidates have fared so far:
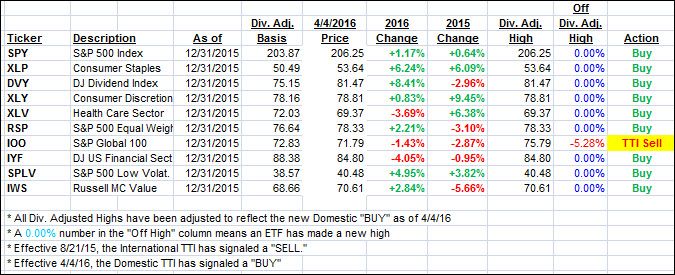
Again, the first table above shows the position of the various ETFs in relation to their respective long term trend lines (%M/A), while the second one tracks their trailing sell stops in the “Off High” column. The “Action” column will signal a “Sell” once the -7.5% point has been taken out in the “Off High” column.
3. Trend Tracking Indexes (TTIs)
Our Domestic Trend Tracking Index (TTI) edged higher and market activity confirmed our new domestic Buy signal. For tracking purposes, the effective date is today.
I have started to ease back into equities with limited exposure since, after the massive March rebound, we could certainly see a pullback. My ETF choices contain some good performers but I am staying away from the high fliers (high momentum numbers), as those will fall the hardest once markets start to slip.
Here’s how we closed today:
Domestic TTI: +1.33% (last close +1.25%)—Buy signal effective 4/4/2016
International TTI: -2.39% (last close -2.25%)—Sell signal effective 8/21/2015
Disclosure: I am obliged to inform you that I, as well as advisory clients of mine, own some of these listed ETFs. Furthermore, they do not represent a specific investment recommendation for you, they merely show which ETFs from the universe I track are falling within the guidelines specified.
Contact Ulli