
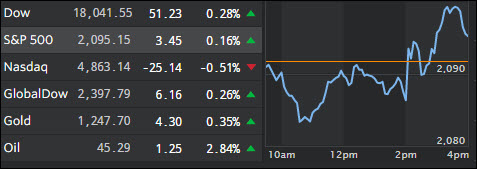
1. Moving the Markets
As was to be expected, the Fed held interest rates steady for the third consecutive meeting. The FOMC statement was neutral and contained the usual language of “assessing economic and labor conditions, inflationary pressures and expectations along with readings on financial and international developments before determining the size of future interest rate adjustments,” which leaves things wide open to their discretion.
The market’s reaction was slightly bullish but lacking the exuberance of the past, which could indicate that the bull market is getting tired. Although this afternoon, the beaten down Nasdaq received some good news for a change when Facebook (FB) crushed earnings estimates and saw its shares skyrocket by some 9% as of this writing.
Whether this was simply an outlier when it comes to tech world earnings remains to be seen, but I am curious if these numbers are enough to prop up the major indexes, at least for the short term.
2. ETFs in the Spotlight
In case you missed the announcement and description of this section, you can read it here again.
It features 10 broadly diversified ETFs from my HighVolume list as posted every Monday. Furthermore, they are screened for the lowest MaxDD% number meaning they have been showing better resistance to temporary sell offs than all others over the past year.
Here are the 10 candidates:
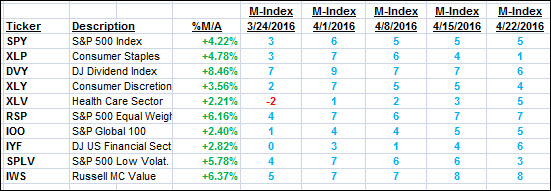
The above table simply demonstrates the magnitude with which some of the ETFs are fluctuating in regards to their positions above or below their respective individual trend lines (%M/A). A break below, represented by a negative number, shows weakness, while a break above, represented by a positive percentage, shows strength.
For hundreds of ETF/Mutual fund choices, be sure to reference Thursday’s StatSheet.
Year to date, here’s how the above candidates have fared so far:
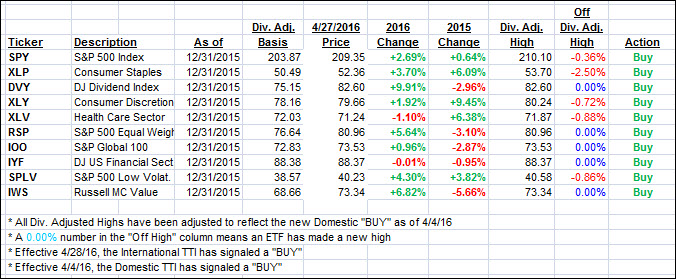
Again, the first table above shows the position of the various ETFs in relation to their respective long term trend lines (%M/A), while the second one tracks their trailing sell stops in the “Off High” column. The “Action” column will signal a “Sell” once the -7.5% point has been taken out in the “Off High” column.
3. Trend Tracking Indexes (TTIs)
Our Domestic Trend Tracking Index (TTI) inched up a tad, but the International TTI confirmed its bullish move and, effective 4/28//2016, a new BUY signal for that arena has been generated. To be clear, this bullish signal covers only “broadly diversified international mutual funds/ETFs.”
Here’s how we ended up:
Domestic TTI: +1.66% (last close +1.63%)—Buy signal effective 4/4/2016
International TTI: +1.01% (last close +0.79%)—Buy signal effective 4/28/2016
Disclosure: I am obliged to inform you that I, as well as advisory clients of mine, own some of these listed ETFs. Furthermore, they do not represent a specific investment recommendation for you, they merely show which ETFs from the universe I track are falling within the guidelines specified.
Contact Ulli