
1. Moving the Markets
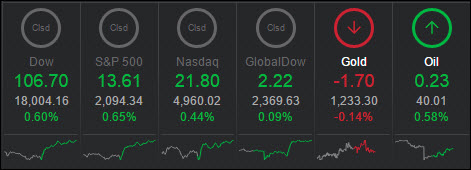
Despite yesterday’s miserable failure of the OPECers to come to a production limitation agreement, the markets headed north with the S&P climbing to a 4-month high while the Dow managed to close above the 18,000 level, its highest point since last July.
When news of the OPEC failure came out yesterday, oil crashed 7% in the futures market, but managed to rally 8% recovering all losses on… well… no real news other than the next set of speculation that China’s slowdown is easing while central banks are primed to push for more growth.
Helping equities was Fed Pres Dudley when he chimed in that “inflation will firm, and corporate earnings have so far largely topped sharply reduced estimates.” Sure, even JP Morgan’s 52% crash in earnings was good news, since it was better-than-expected.
Speaking of earnings, remember when they used to be the main item that determined stock prices? Well, no more, as this chart from ZeroHedge shows:
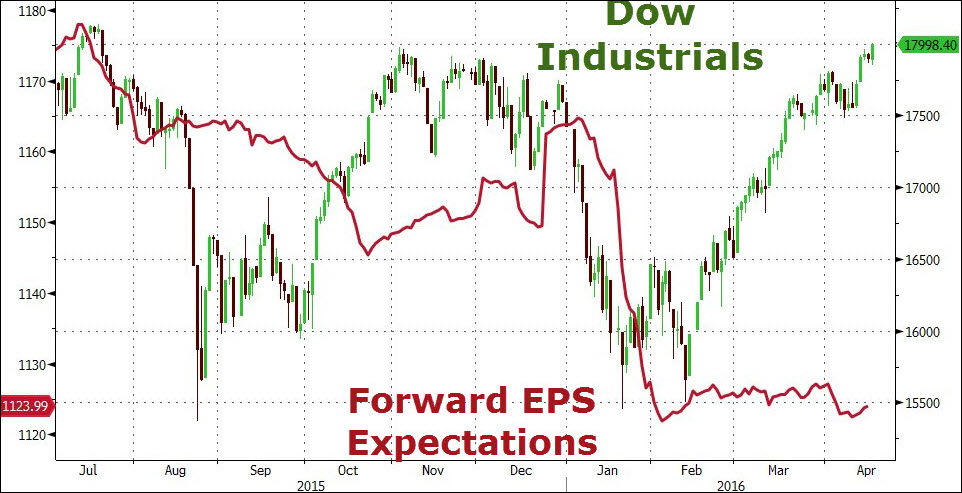
Makes you realize that there are only 2 possibilities; either earnings catapult upwards or the Dow will crash to meet earnings expectations. The open ended question is: which will it be and when will it happen?
2. ETFs in the Spotlight
In case you missed the announcement and description of this section, you can read it here again.
It features 10 broadly diversified ETFs from my HighVolume list as posted every Monday. Furthermore, they are screened for the lowest MaxDD% number meaning they have been showing better resistance to temporary sell offs than all others over the past year.
Here are the 10 candidates:
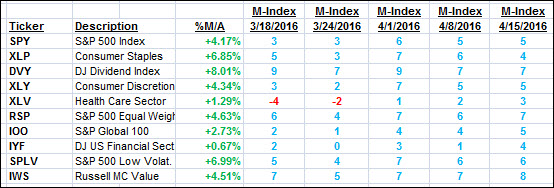
The above table simply demonstrates the magnitude with which some of the ETFs are fluctuating in regards to their positions above or below their respective individual trend lines (%M/A). A break below, represented by a negative number, shows weakness, while a break above, represented by a positive percentage, shows strength.
For hundreds of ETF/Mutual fund choices, be sure to reference Thursday’s StatSheet.
Year to date, here’s how the above candidates have fared so far:
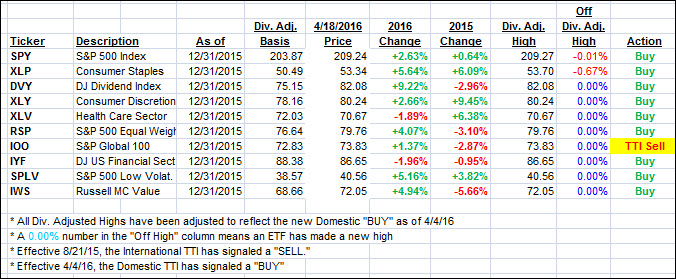
Again, the first table above shows the position of the various ETFs in relation to their respective long term trend lines (%M/A), while the second one tracks their trailing sell stops in the “Off High” column. The “Action” column will signal a “Sell” once the -7.5% point has been taken out in the “Off High” column.
3. Trend Tracking Indexes (TTIs)
Our Domestic Trend Tracking Index (TTI) headed north and settled deeper on the bullish side of its trend line. The International TTI also moved to within striking distance of a new Buy signal. Here again, I want to see a clear piercing to the upside before declaring this bearish cycle to be over.
Here’s how we ended the day:
Domestic TTI: +2.02% (last close +1.80%)—Buy signal effective 4/4/2016
International TTI: -0.02% (last close +0.36%)—Sell signal effective 8/21/2015
Disclosure: I am obliged to inform you that I, as well as advisory clients of mine, own some of these listed ETFs. Furthermore, they do not represent a specific investment recommendation for you, they merely show which ETFs from the universe I track are falling within the guidelines specified.
Contact Ulli