
1. Moving the Markets
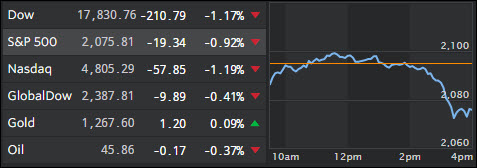
The major indexes had not much too cheer about during the regular session, which started on a bad omen from Japan with the BoJ surprising world markets by capping their monetary stimulus, which was expected to continue with full force. As we all know by now, without central bank stimulus, equity markets will not be able to cling to these lofty levels for any length of time.
The Nikkei dropped some 1,500 points right out of the gate but managed to recover half of that during the session. Then China stepped on the breaks attempting to control its latest bubble, namely the insane volume contributed to wild commodity speculation.
And last not least, mega investor Carl Icahn disclosed, after having advocated a price target for Apple (AAPL) of some $240 over the past few years, that he had changed his mind and had liquidated all holdings. That did not sit well with Wall Street and Apple gave back another 3% leaving it wide open as to which major institutional investors, like hedge funds, will be the next ones to pull the trigger.
Saving the afternoon session were Amazon, LinkedIn and Pandora, all of which beat earnings estimates.
2. ETFs in the Spotlight
In case you missed the announcement and description of this section, you can read it here again.
It features 10 broadly diversified ETFs from my HighVolume list as posted every Monday. Furthermore, they are screened for the lowest MaxDD% number meaning they have been showing better resistance to temporary sell offs than all others over the past year.
Here are the 10 candidates:
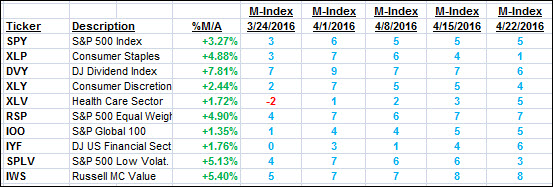
The above table simply demonstrates the magnitude with which some of the ETFs are fluctuating in regards to their positions above or below their respective individual trend lines (%M/A). A break below, represented by a negative number, shows weakness, while a break above, represented by a positive percentage, shows strength.
For hundreds of ETF/Mutual fund choices, be sure to reference Thursday’s StatSheet.
Year to date, here’s how the above candidates have fared so far:
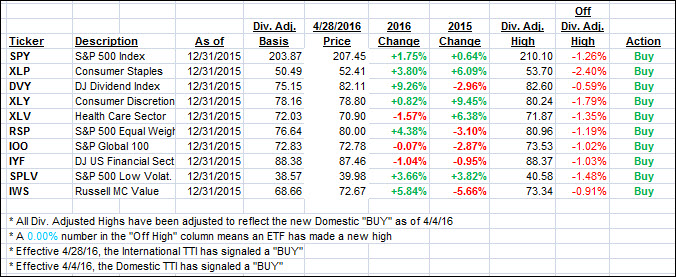
Again, the first table above shows the position of the various ETFs in relation to their respective long term trend lines (%M/A), while the second one tracks their trailing sell stops in the “Off High” column. The “Action” column will signal a “Sell” once the -7.5% point has been taken out in the “Off High” column.
3. Trend Tracking Indexes (TTIs)
Our Domestic Trend Tracking Index (TTI) pulled back as the major indexes retreated after an early rally attempt failed. We remain in “Buy” mode with limited exposure.
Here’s how we closed:
Domestic TTI: +1.42% (last close +1.66%)—Buy signal effective 4/4/2016
International TTI: +0.50% (last close +1.01%)—Buy signal effective 4/28/2016
Disclosure: I am obliged to inform you that I, as well as advisory clients of mine, own some of these listed ETFs. Furthermore, they do not represent a specific investment recommendation for you, they merely show which ETFs from the universe I track are falling within the guidelines specified.
Contact Ulli