
1. Moving the Markets
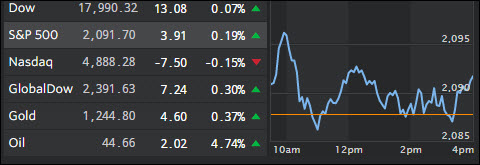
It was a fairly quiet day during the regular session despite a host of economic data points that can be summed up with one word: dismal. But none of that matters in a centrally planned economy where fundamentals are immaterial and where Wall Street hangs on to every new utterance by the the masters of the financial universe, namely the Fed.
This was the case today with poor economic data being brushed aside as all eyes are now on the Fed when they release the latest monetary policy statement due out tomorrow around 11:15 PST. A rate hike is not expected but the search for hints as to the timing of the next one will be on everyone’s mind.
This afternoon Twitter got crushed and lost over 14% while Apple disappointed and dropped some 8% as of this writing. At the same time, the FANGs (Facebook, Amazon, Netflix, Google) had their worst 3-day run in almost 3 months. None of this will bode well for the Nasdaq’s opening tomorrow morning. But, I am hopeful that the Fed as usual will come to the rescue…
2. ETFs in the Spotlight
In case you missed the announcement and description of this section, you can read it here again.
It features 10 broadly diversified ETFs from my HighVolume list as posted every Monday. Furthermore, they are screened for the lowest MaxDD% number meaning they have been showing better resistance to temporary sell offs than all others over the past year.
Here are the 10 candidates:
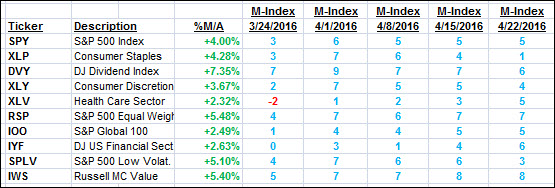
The above table simply demonstrates the magnitude with which some of the ETFs are fluctuating in regards to their positions above or below their respective individual trend lines (%M/A). A break below, represented by a negative number, shows weakness, while a break above, represented by a positive percentage, shows strength.
For hundreds of ETF/Mutual fund choices, be sure to reference Thursday’s StatSheet.
Year to date, here’s how the above candidates have fared so far:
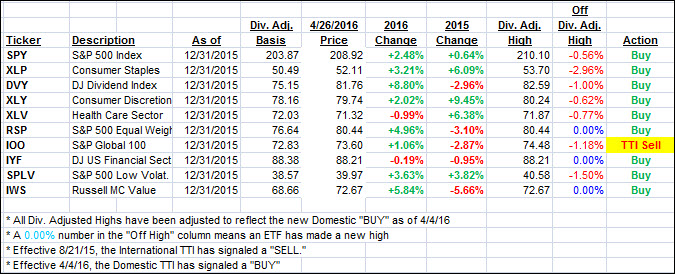
Again, the first table above shows the position of the various ETFs in relation to their respective long term trend lines (%M/A), while the second one tracks their trailing sell stops in the “Off High” column. The “Action” column will signal a “Sell” once the -7.5% point has been taken out in the “Off High” column.
3. Trend Tracking Indexes (TTIs)
Our Domestic Trend Tracking Index (TTI) barely moved as the indexes cautiously stayed in a tight range ahead of the Fed’s announcement on interest rates.
Here’s how we closed:
Domestic TTI: +1.63% (last close +1.61%)—Buy signal effective 4/4/2016
International TTI: +0.79% (last close +0.66%)—Sell signal effective 8/21/2015
Disclosure: I am obliged to inform you that I, as well as advisory clients of mine, own some of these listed ETFs. Furthermore, they do not represent a specific investment recommendation for you, they merely show which ETFs from the universe I track are falling within the guidelines specified.
Contact Ulli