
1. Moving the Markets
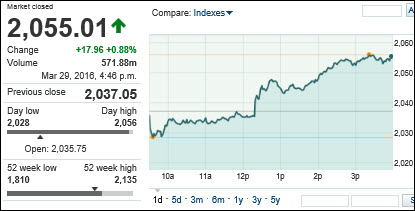
Both the Dow and S&P 500 closed at high water marks for 2016. Movement upward today was driven mostly by Janet Yellen’s speech today in New York wherein she said the central bank will “move cautiously” on interest rate hikes. The “cautious” stance is mostly due to risks of a weak global economy and low inflation. In other words, the promise of interest normalization via 4 small hikes during 2016 went out the window. Imagine a tiny 0.25% hike is considered too much for the economy to handle, which gives you an idea of the true state of affairs.
In the end, we all know by now that economic data points no longer matter, as the Fed alone determines market direction via its dovish or hawkish announcements. Even oil, which has led the S&P higher during most of March, decoupled and lost over 2% on the day while equities rallied.
I mentioned investors will be eyeing economic news this week. Today, we saw data on consumer confidence and home prices. Home prices rose 5.7% YoY. Seattle, San Francisco and Portland led the pack. The consumer confidence index rose 96.2% in March, up from 94 in February.
We heard a bit of shocking news today that SunEdison (SUNE) is flirting with bankruptcy amid questions over the company’s accounting practices and falling oil prices. Shares of the stock tumbled 41% in pre-market trading to 74 cents a share. Analysts say the company’s biggest issue is lack of liquidity.
Stay tuned for the all important employment figures this Friday.
2. ETFs in the Spotlight
In case you missed the announcement and description of this section, you can read it here again.
It features 10 broadly diversified ETFs from my HighVolume list as posted every Monday. Furthermore, they are screened for the lowest MaxDD% number meaning they have been showing better resistance to temporary sell offs than all others over the past year.
Here are the 10 candidates:
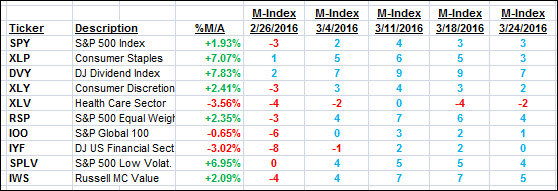
The above table simply demonstrates the magnitude with which some of the ETFs are fluctuating in regards to their positions above or below their respective individual trend lines (%M/A). A break below, represented by a negative number, shows weakness, while a break above, represented by a positive percentage, shows strength.
For hundreds of ETF/Mutual fund choices, be sure to reference Thursday’s StatSheet.
Year to date, here’s how the above candidates have fared so far:
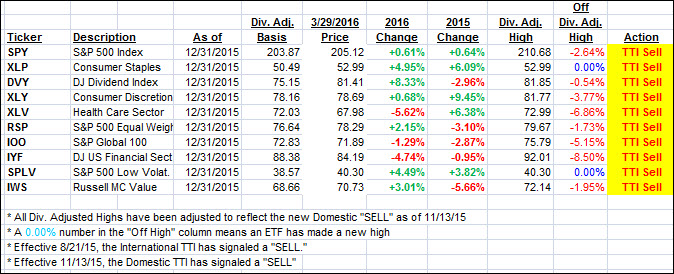
Again, the first table above shows the position of the various ETFs in relation to their respective long term trend lines (%M/A), while the second one tracks their trailing sell stops in the “Off High” column. The “Action” column will signal a “Sell” once the -7.5% point has been taken out in the “Off High” column.
3. Trend Tracking Indexes (TTIs)
Our Domestic Trend Tracking Index (TTI) improved and is now within striking distance of a new Buy signal. If we pierce through the +1% level and hold there for a couple of days, we will start easing back into equities. Barring any unforeseen event, I would expect that to happen by the beginning of next week.
Here’s how we closed:
Domestic TTI: +0.90% (last close +0.35%)—Sell signal effective 11/13/2015
International TTI: -2.48% (last close -3.43%)—Sell signal effective 8/21/2015
Disclosure: I am obliged to inform you that I, as well as advisory clients of mine, own some of these listed ETFs. Furthermore, they do not represent a specific investment recommendation for you, they merely show which ETFs from the universe I track are falling within the guidelines specified.
Contact Ulli