
1. Moving the Markets
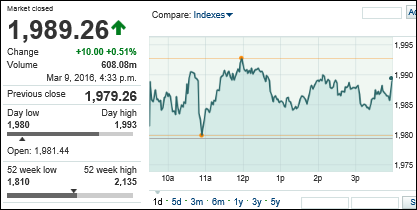
Spanning headlines today were 7-year anniversary nods to the bull market. Stocks gained slightly as the bear market rebound that has been in place since February 11 is trying to continue with investors latching on to recent data hoping that the the U.S. is not headed for an imminent recession.
In M&A News, Facebook (F) was in focus today as it is heating up competition with Snapchat via the purchase of Masquerade. Masquerade makes imaging software that jazzes up videos and selfies with fun filters, masks and other special effects. The acquisition is part of Facebook’s ongoing push to capture the youth vote by giving users the ability to add filters, text, emojis and stickers to photos and videos. The purchase price was not disclosed.
Wall Street will be looking ahead to a key meeting of the European Central Bank (ECB) tomorrow. Investors expect the ECB deliver on its promises to deliver more stimulus measures by pulling out the big bazooka to help counteract weak growth and tepid inflation in the eurozone. The ECB is also expected to push interest rates deeper into negative territory. Any disappointment will likely be met with a sell-off.
2. ETFs in the Spotlight
In case you missed the announcement and description of this section, you can read it here again.
It features 10 broadly diversified ETFs from my HighVolume list as posted every Monday. Furthermore, they are screened for the lowest MaxDD% number meaning they have been showing better resistance to temporary sell offs than all others over the past year.
Here are the 10 candidates:
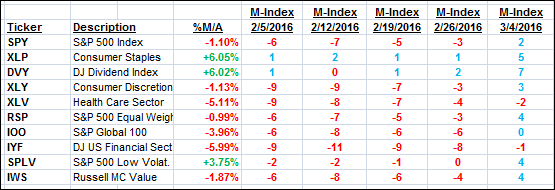
The above table simply demonstrates the magnitude with which some of the ETFs are fluctuating in regards to their positions above or below their respective individual trend lines (%M/A). A break below, represented by a negative number, shows weakness, while a break above, represented by a positive percentage, shows strength.
For hundreds of ETF/Mutual fund choices, be sure to reference Thursday’s StatSheet.
Year to date, here’s how the above candidates have fared so far:
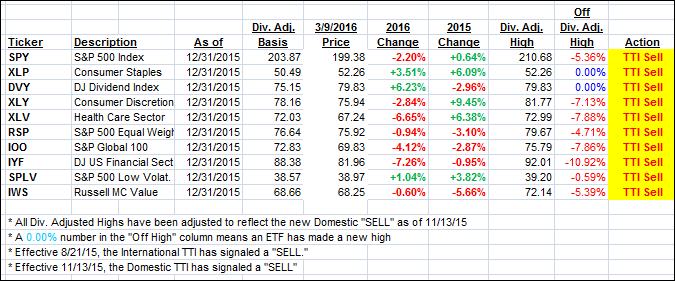
Again, the first table above shows the position of the various ETFs in relation to their respective long term trend lines (%M/A), while the second one tracks their trailing sell stops in the “Off High” column. The “Action” column will signal a “Sell” once the -7.5% point has been taken out in the “Off High” column.
3. Trend Tracking Indexes (TTIs)
Our Domestic Trend Tracking Index (TTI) changed only slightly with no effect on our current bearish stance.
Here’s how we ended up:
Domestic TTI: -0.68% (last close -0.80%)—Sell signal effective 11/13/2015
International TTI: -5.58% (last close -5.76%)—Sell signal effective 8/21/2015
Disclosure: I am obliged to inform you that I, as well as advisory clients of mine, own some of these listed ETFs. Furthermore, they do not represent a specific investment recommendation for you, they merely show which ETFs from the universe I track are falling within the guidelines specified.
Contact Ulli