
1. Moving the Markets
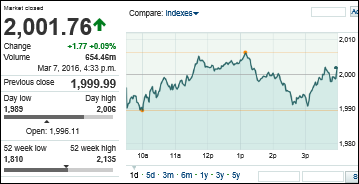
Stocks are showing signs of fatigue to kick off the new week, ending mixed Monday after a robust three-week short-covering rally, the biggest ever in history, that helped trim the big losses suffered early in 2016. The Dow and S&P 500 gained minimal and the Nasdaq slipped 2%.
Crude Oil received a lot of attention today from investors. The “black gold” commodity jumped up above $40 at one point today and closed at $37.98, which marked a 5.73% gain.
There is a hearty portion of economic data on deck this week to move markets. On Tuesday, Wall Street gets the February reading on small business optimism, on Wednesday January wholesale inventories, to name a few. Investors remain focused on the state of both the domestic and global economies, China in particular as its recent slowed growth has been sending markets into turmoil with ease.
Also coming up, global investors will be closely watching the European Central Bank’s meeting on Thursday, when the eurozone central bank is expected to further push short-term borrowing rates into negative territory in an effort to jump start growth and boost low inflation readings.
2. ETFs in the Spotlight
In case you missed the announcement and description of this section, you can read it here again.
It features 10 broadly diversified ETFs from my HighVolume list as posted every Monday. Furthermore, they are screened for the lowest MaxDD% number meaning they have been showing better resistance to temporary sell offs than all others over the past year.
Here are the 10 candidates:
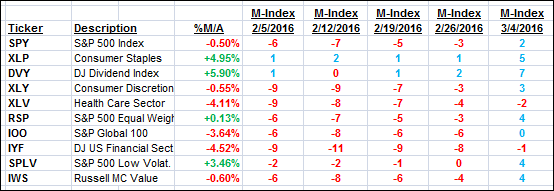
The above table simply demonstrates the magnitude with which some of the ETFs are fluctuating in regards to their positions above or below their respective individual trend lines (%M/A). A break below, represented by a negative number, shows weakness, while a break above, represented by a positive percentage, shows strength.
For hundreds of ETF/Mutual fund choices, be sure to reference Thursday’s StatSheet.
Year to date, here’s how the above candidates have fared so far:
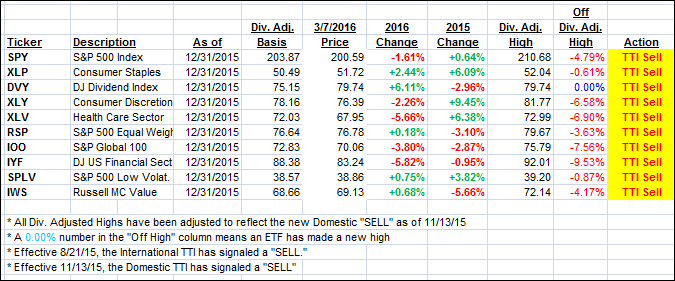
Again, the first table above shows the position of the various ETFs in relation to their respective long term trend lines (%M/A), while the second one tracks their trailing sell stops in the “Off High” column. The “Action” column will signal a “Sell” once the -7.5% point has been taken out in the “Off High” column.
3. Trend Tracking Indexes (TTIs)
Our Domestic Trend Tracking Index (TTI) changed only immaterially as the major indexes predominantly moved sideways.
Here’s how we closed:
Domestic TTI: -0.46% (last close -0.41%)—Sell signal effective 11/13/2015
International TTI: -4.52% (last close -4.63%)—Sell signal effective 8/21/2015
Disclosure: I am obliged to inform you that I, as well as advisory clients of mine, own some of these listed ETFs. Furthermore, they do not represent a specific investment recommendation for you, they merely show which ETFs from the universe I track are falling within the guidelines specified.
Contact Ulli